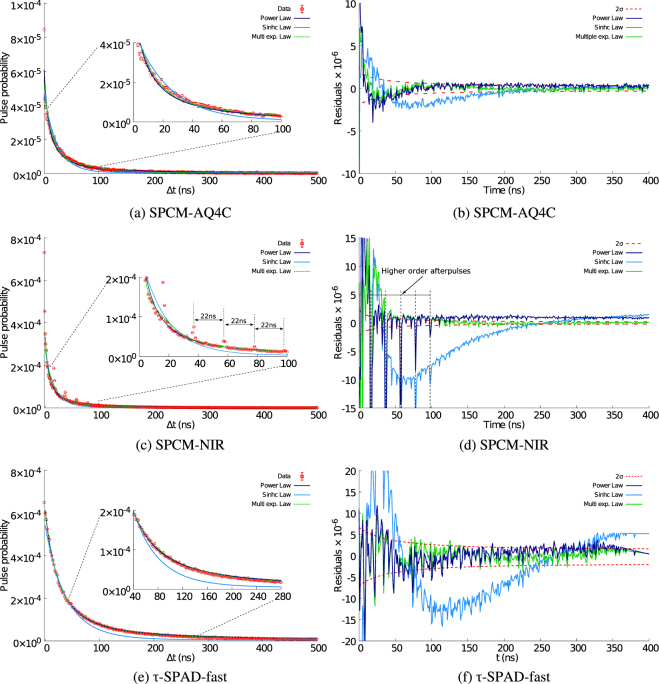
Figure 2.
Afterpulse peak’s tail fitted with Power law model, Hyperbolic-sinc model and multiple exponential model for SPCM-AQ4C (PerkinElmer), SPCM-NIR (Excelitas) and τ-SPAD-fast (Laser Components) - Comparison of residuals for all detectors and models (Power law model (blue), Hyperbolic sinc model (cyan) and Multiple exponential model (green)) and the red dashed lines are ±2 standard deviation limits for statistical fluctuations (2σ). We analysed > 0.14 × 10⁶, 2.7 × 10⁶ and 3 × 10⁶ afterpulse events for each SPCM-AQ4C, SPCM-NIR, and τ-SPAD-fast detector.

