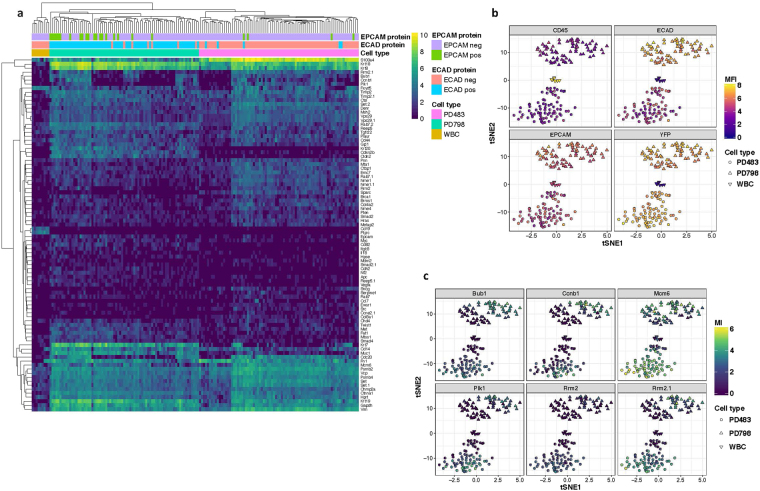
Figure 6.
Integration of single cell sorting with BD Precise™ assay. (a) Heat map showing unsupervised hierarchical clustering of Molecular Index (MI) counts of 88 transcripts representing 78 genes in PD798, PD483, and WBCs. For visualization purposes, genes with total counts lower than 64 MI (1 SD below mean) were filtered out. Scale bar refers to log 2 MI counts. Expression of EPCAM and ECAD protein, as detected by flow cytometry, is denoted above heat map. (b) t-SNE analysis of gene expression of PD798 (triangle), PD483 (circle) and WBCs (inverted triangle) colored by log 10 mean fluorescence intensity (MFI) of CD45 (upper left), ECAD (upper right), EPCAM (lower left), and YFP (lower right). (c) t-SNE plots colored by expression of cell cycle genes Bub1, Ccnb1, Mcm6, Rrm2, Rrm2.1 (designates alternate Rrm2 transcript), and Plk1 (starting with upper left and moving clockwise). Scale bar refers to log 2 MI counts.

