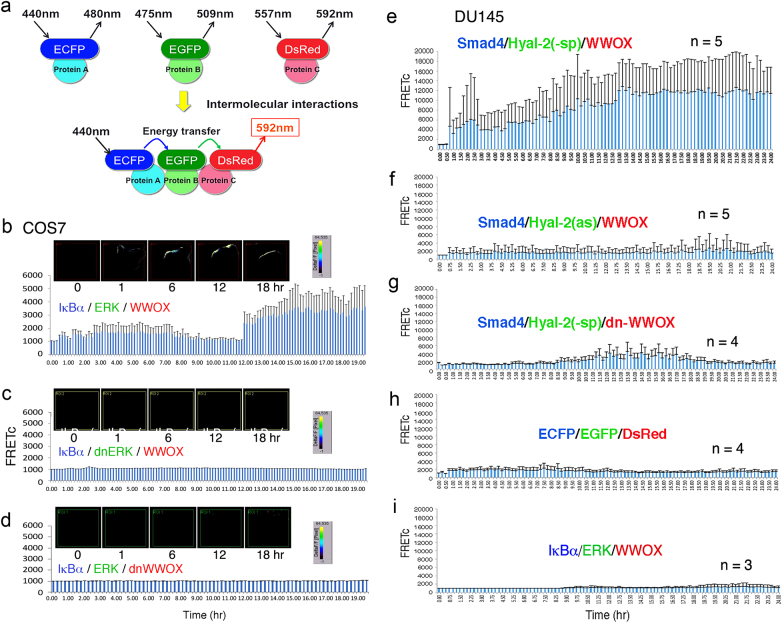
Fig. 1. HA initiates Hyal-2/WWOX/Smad4 signaling for bubbling cell death.
a A depicted graph for the designed tri-molecular FRET analysis is shown. Energy is transferred from ECFP to EGFP and then to DsRed. Briefly, cells were stimulated with an excitation wavelength of 440 nm and emission at 480 nm, which was received by EGFP. EGFP transfers the energy from excitation at 475 nm to emission at 509 nm, which activates DsRed (excitation at 557 nm and emission at 592 nm). FRET signals are detected at an emission wavelength of 592 nm. The FRET images were corrected for background fluorescence from an area free of cells. The spectrally corrected FRET concentration (FRETc) was calculated using an internal software program in the Olympus machine19,20. b COS7 cells were transiently overexpressed with ECFP-IκBα, EGFP-ERK, and DsRed-monomer WWOX and exposed to IoP for time-lapse FRET microscopy13. No cell death occurred. The bar graph is an average of two experiments and its range. The FRET images were corrected for background fluorescence13–18. The spectrally corrected FRET concentration (FRETc) was calculated13–18. c, d In negative controls, cells were transiently overexpressed with an indicated dominant-negative EGFP-dnERK or DsRed-monomer dnWWOX (mean ± SD, n = 3)13. Also, see additional controls using ECFP, EGFP, and/or DsRed vectors only in the Supplemental Data. e–g DU145 cells were transiently transfected with ECFP-Smd4, EGFP-Hyal-2(-sp) (for cytosolic expression), EGFP-Hyal-2(as) for antisense mRNA, and DsRed-monomer-WWOX expression constructs. HA/Hyal-2 initiates the signaling from the cell surface for the complex formation of ectopic Smad4, Hyal-2, and WWOX14. h, i HA did not induce complex formation of ECFP/EGFP/DsRed and IκBα/ERK/WWOX in DU145 cells14 (data in b−d adapted from ref. 13 with modifications and permissions from J. Biol. Chem.; e−i adapted from ref. 14 with permissions from Oncotarget)

