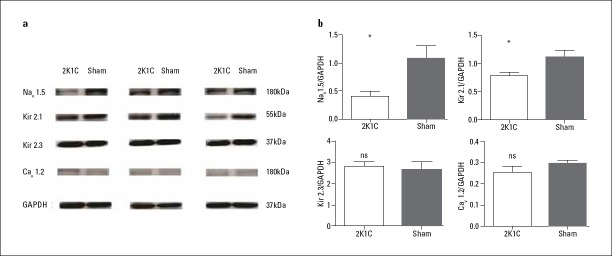
Figure 5.
Protein levels of the ion channel components Nav1.5, Kir2.1, Kir2.3, and Cav1.2, analyzed by western blot and normalized to GAPDH
Data are expressed as mean±SD. *p<0.05 vs. sham-operated group (n=6)
Cav1.2, L-type Ca2+-subunit Cav1.2; GAPDH, glyceraldehyde phosphate dehydrogenase; Kir, inward rectifyimg potassium channel; Nav1.5, voltage-gated sodium channel subunit Nav1.5; ns, not significant

