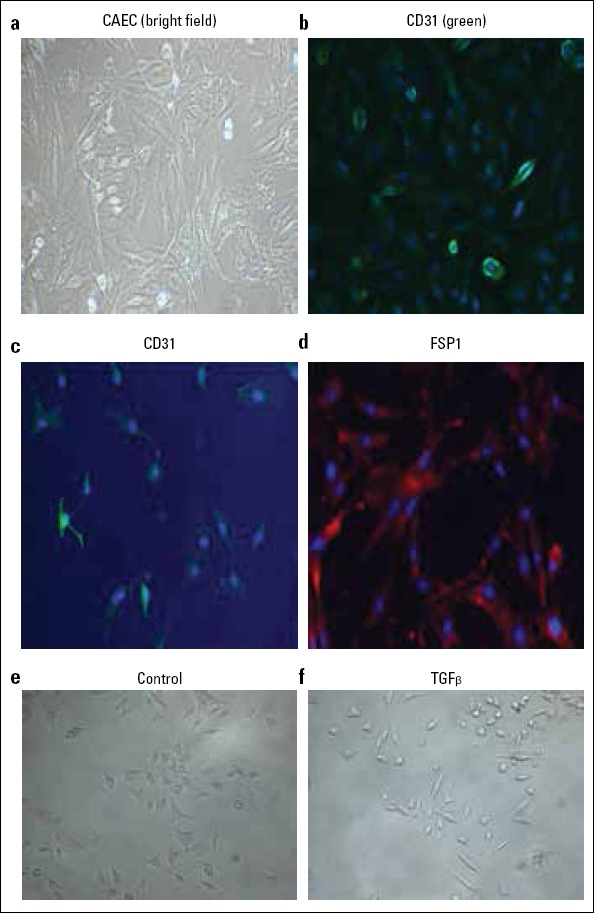
Figure 1.

TGF-β1-induced EndMT in rat CAEC. The morphology of rat CAEC was shown as bright field image (a). Immunofluorescence staining of CD31 (green) in rat CAEC (b). Immunofluorescence staining of CD31 (c) and FSP1 (d) in TGF-β1-treated rat CAEC. E&F: typical morphology comparison for EndMT in rat CAEC between Control and TGF-β1 group
