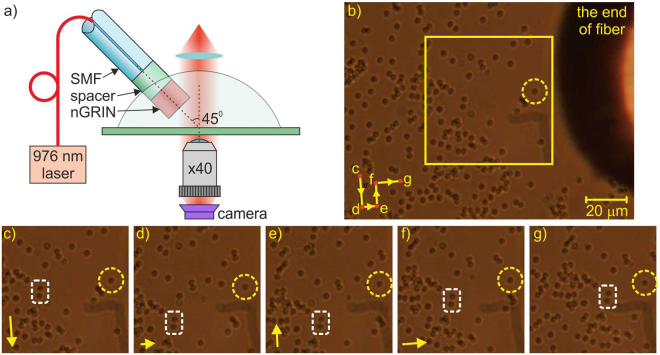
Figure 6.
Demonstration of the 2D optical trapping of a single glass bead (results for 120 mW output light power): (a) Scheme of the trapping setup, (b) observed area (a sequence of movement of the trapped beads is presented in the lower left corner, letters indicate sequence of figures) (c–g), the trapped elements are surrounded by a yellow dashed line circle, two reference beads are surrounded by a white dashed line rectangle, and the yellow frame marks an enlarged field of observation), (c–g) subsequent positions of the silica beads (the arrows in the lower left-hand corner indicate the direction of movement of the trapped beads towards position indicated at the next figure). (Supplementary materials: Movie 1.avi).

