Fig. 7.
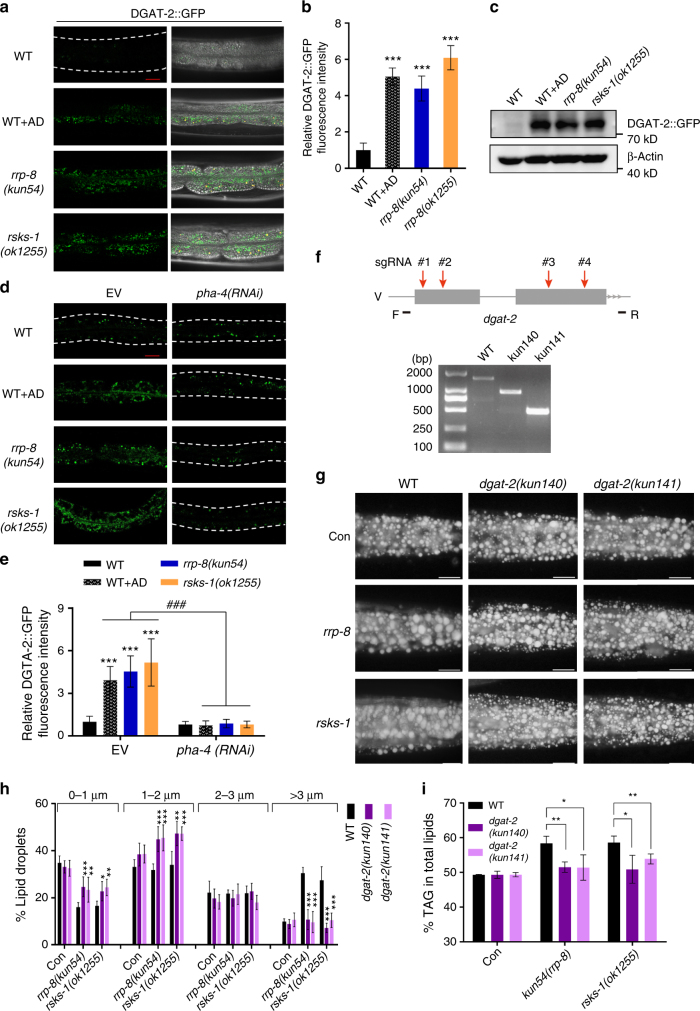
Nucleolar stress induces dgat-2 expression to promote lipid accumulation. a Confocal microscopy of DGAT-2::GFP in WT, rrp-8(kun54), rsks-1(ok1255), and AD-treated worms. Scale bar represents 20 µm in the panel. b Relative fluorescence intensity of DGAT-2::GFP quantified from a. Data are presented as the means ± SD of at least 20 worms for each worm strain. Significant difference between WT and a specific worm strain, Student’s t-test, ***P < 0.001. c Immunoblotting of DGAT-2::GFP. One-day-old WT, rrp-8(kun54), rsks-1(ok1255), and AD-treated worms expressing DGAT-2::GFP were collected for lysing and immunoblotting with anti-GFP antibody. d Confocal microscopy of DGAT-2::GFP fluorescence in WT, rrp-8(kun54), rsks-1(ok1255), and AD-treated worms treated with either empty vector (EV) or pha-4 RNAi from L1 to day 1 of adulthood. Scale bar represents 20 μm. e Relative fluorescence intensity of DGAT-2::GFP quantified from d. Data are presented as the means ± SD of at least 20 worms for each worm strain. Significant difference between WT and a specific worm strain, Student’s t-test, ***P < 0.001. Significant difference between a specific strain treated with empty vector (EV) and pha-4 RNAi, ###P < 0.001. f Schematic diagram of the generation of kun140 and kun141 mutations of dgat-2 using multi-sgRNA-directed CRSPR/cas-9 technology (upper panel). Deletion of the kun140 and kun141 mutations of dgat-2 was confirmed using PCR (lower panel). g Nile Red staining of fixed 1-day-old adult worms. Representative animals; the anterior is indicated on the left and the posterior is indicated on the right. Scale bar represents 20 μm. h Distribution of the lipid droplet size (% lipid droplets) measured by Nile Red staining of fixed worms from g. Data are presented as the means ± SD of 10 animals for each worm strain. Significant difference between a specific mutant strain without (EV) and with RNAi treatment, Student’s t-test, ***P < 0.001, **P < 0.01, *P < 0.05. i Percentage of triacylglycerol (% TAG) in total lipids (TAG + phospholipids, PL) analyzed by TLC/GC. Data are presented as the means ± SD of four biological repeats. Significant difference between a specific mutant strain with and without dgat-2 mutant background, Student’s t-test, **P < 0.01, *P < 0.05

