. 2018 Mar 16;6:54. doi: 10.3389/fchem.2018.00054
Copyright © 2018 Debiec, Rzepa, Bajda, Uhrynowski, Sklodowska, Krzysztoforski and Drewniak.
This is an open-access article distributed under the terms of the Creative Commons Attribution License (CC BY). The use, distribution or reproduction in other forums is permitted, provided the original author(s) and the copyright owner are credited and that the original publication in this journal is cited, in accordance with accepted academic practice. No use, distribution or reproduction is permitted which does not comply with these terms.
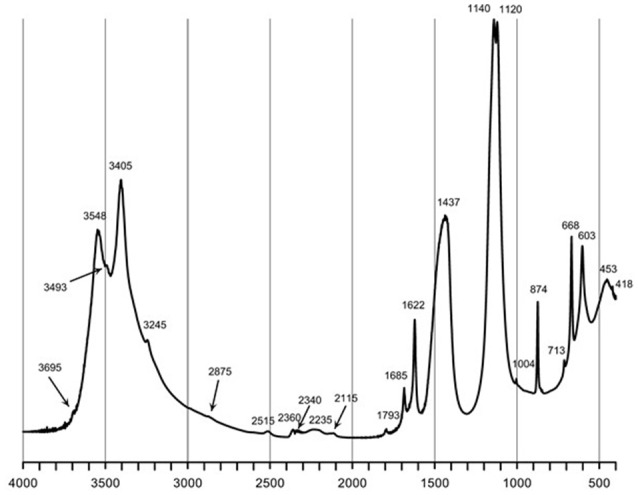
Figure 3.

FTIR spectrum of the gBIOs. The numbers denote positions of the absorption bands.
