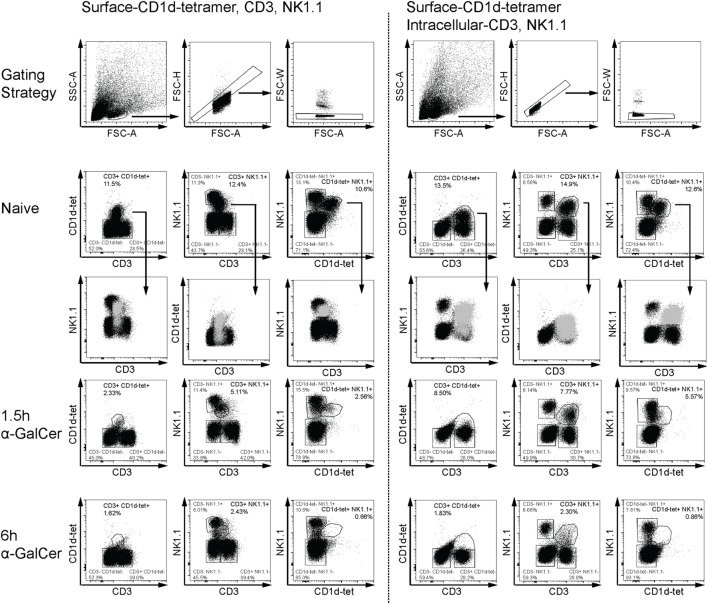
Figure 1.
Flow cytometry-based detection of liver natural killer T (NKT) cells. Liver leukocytes from naïve or α-GalCer-challenged mice were stained with surface CD1d tetramer (CD1d-tet). Half of the liver sample was stained for surface expression of CD3 and NK1.1 (left panel), while the other half was permeabilized for intracellular expression of CD3 and NK1.1 (right panel). Various gating strategies for CD3, NK1.1, and CD1d-tet expression over time are shown as a comparison of surface and intracellular expression. Putative “NKT” cells from naïve mice (light gray) have been overlayed to show placement within dot plots using the third marker. Surface expression of all three markers are reduced as early as 1.5 h after α-galactosylceramide (α-GalCer) challenge (left panel); however, intracellular CD3 and NK1.1 expression is sustained at this early time point (right panel). Data are representative of three mice per time point.

