
Figure 2.
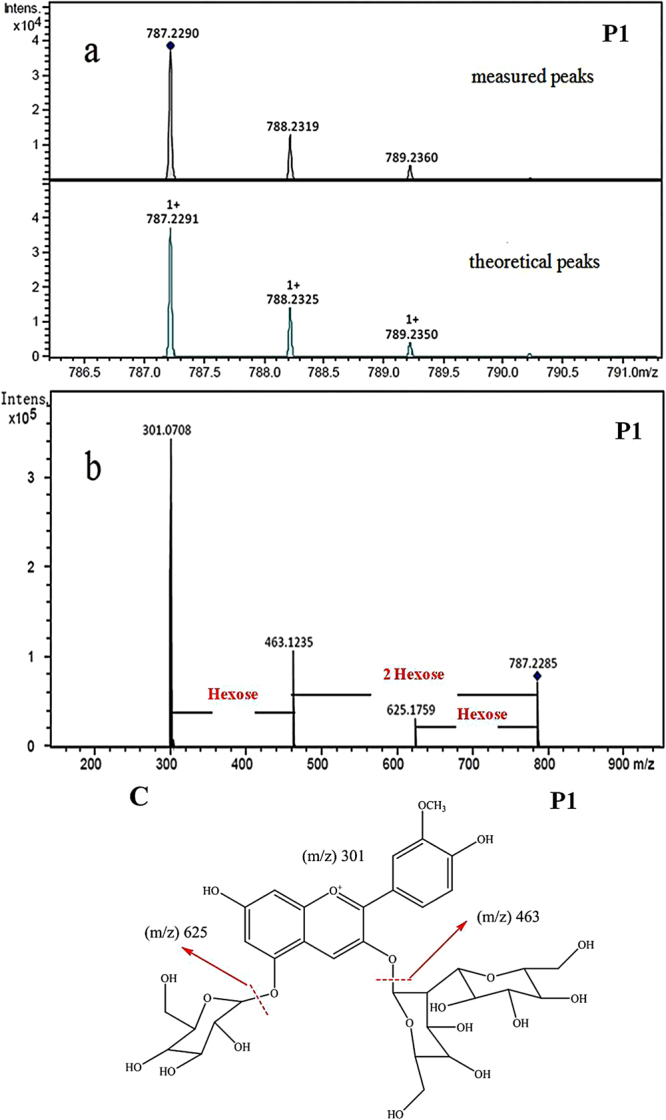
Mass spectrometric data and chemical structure of peonidin-based anthocyanins. (a) HPLC-TOF-MS spectrum of P1 (peak 2), (b) HPLC-TOF-MS/MS spectrum of P1 (peak 2), (c) chemical structure of P1 (peak 2).
Official websites use .gov
A
.gov website belongs to an official
government organization in the United States.
Secure .gov websites use HTTPS
A lock (
) or https:// means you've safely
connected to the .gov website. Share sensitive
information only on official, secure websites.
Mass spectrometric data and chemical structure of peonidin-based anthocyanins. (a) HPLC-TOF-MS spectrum of P1 (peak 2), (b) HPLC-TOF-MS/MS spectrum of P1 (peak 2), (c) chemical structure of P1 (peak 2).