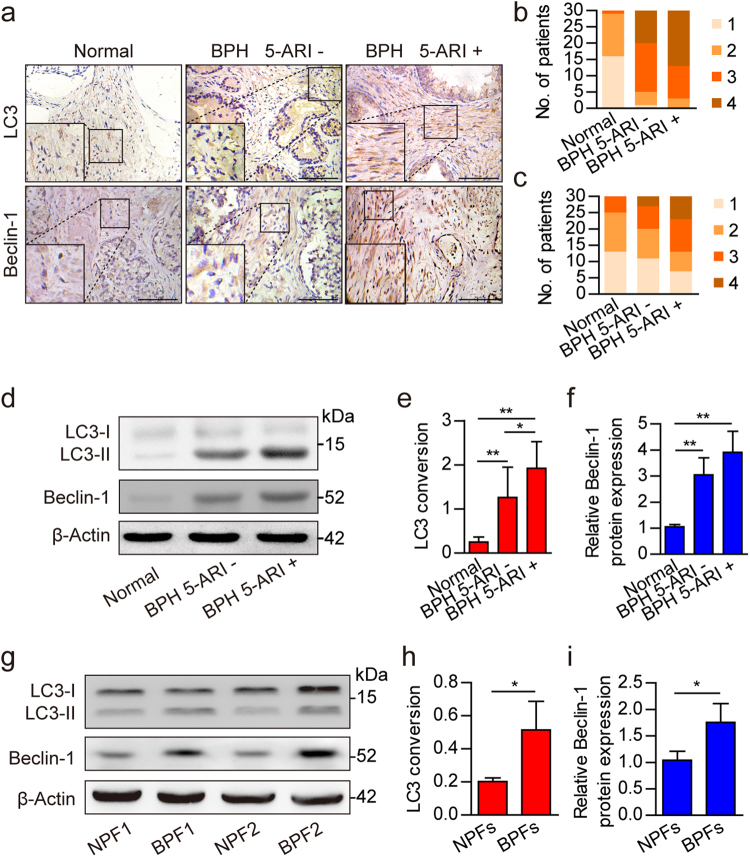
Fig. 1. Expression levels of autophagy-related proteins in normal prostate and BPH tissues.
a Immunohistochemistry results showing LC3 and Beclin-1 expression levels in normal prostate and BPH tissues after 5-ARI treatment (5-ARI+) or without 5-ARI treatment (5-ARI−). Scale bar, 100 μm. b, c Bar graphs showing patient stratification by stromal LC3 and Beclin-1 expression scores in each group. d Western blot data showing the LC3 conversion ratio (LC3-II/β-Actin) (e) and relative Beclin-1 expression levels (f) in normal prostate and BPH tissues with or without 5-ARI treatment. g Western blot data showing the LC3 conversion ratio (LC3-II/β-Actin) (h) and relative Beclin-1 expression levels (i) in normal prostate fibroblasts (NPFs) and BPH derived prostate fibroblasts (BPFs). *P < 0.05, **P < 0.01

