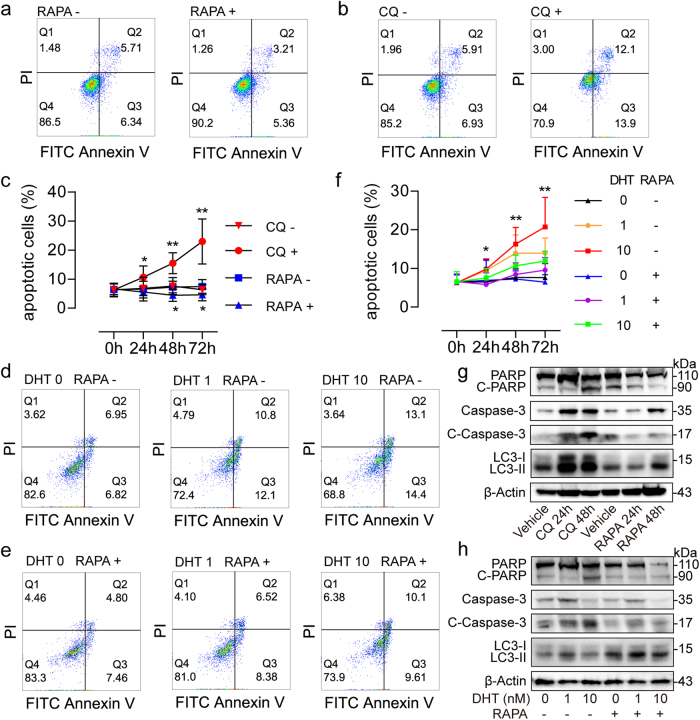
Fig. 3. Apoptosis analyses in prostate stromal fibroblasts.
a Annexin V/PI flow cytometry results showing different apoptotic rates of WPMY-1 cells treated with 50 nM RAPA (RAPA+) or without RAPA (RAPA-) for 48 h. b Annexin V/PI flow cytometry data showing different apoptotic rates of WPMY-1 cells treated with 50 μM CQ (CQ+) or without CQ (CQ−) for 48 h. c Time kinetic curves showing that percentages of Annexin V+/PI− apoptotic WPMY-1 cells changed after 50 nM RAPA or 50 μM CQ treatment for 24, 48, and 72 h, respectively. d, e Annexin V/PI flow cytometry results showing different apoptotic rates of WPMY-AR cells cultured with 0 nM (DHT 0), 1 nM (DHT 1) and 10 nM (DHT 10) DHT, respectively, with 50 nM RAPA (RAPA+) or without RAPA (RAPA−) for 48 h. f Time kinetic curves showing that percentages of Annexin V+/PI− apoptotic WPMY-AR cells changed after treatment with DHT plus 50 nM RAPA for 24, 48, and 72 h, respectively. g Western blot data showing expression change of PARP, cleaved PARP (C-PARP), Caspase-3, and cleaved Caspase-3 (C-Caspase-3) levels as well as LC3 conversions in WPMY-1 cells after 50 μM CQ or 50 nM RAPA treatment for 24 and 48 h. h Western blot results showing expression change of PARP, C-PARP, Caspase-3, and C-Caspase-3 levels as well as LC3 conversions in WPMY-AR cells after treatment with different concentrations of DHT and RAPA (50 nM) treatment for 48 h. *P < 0.05, **P < 0.01

