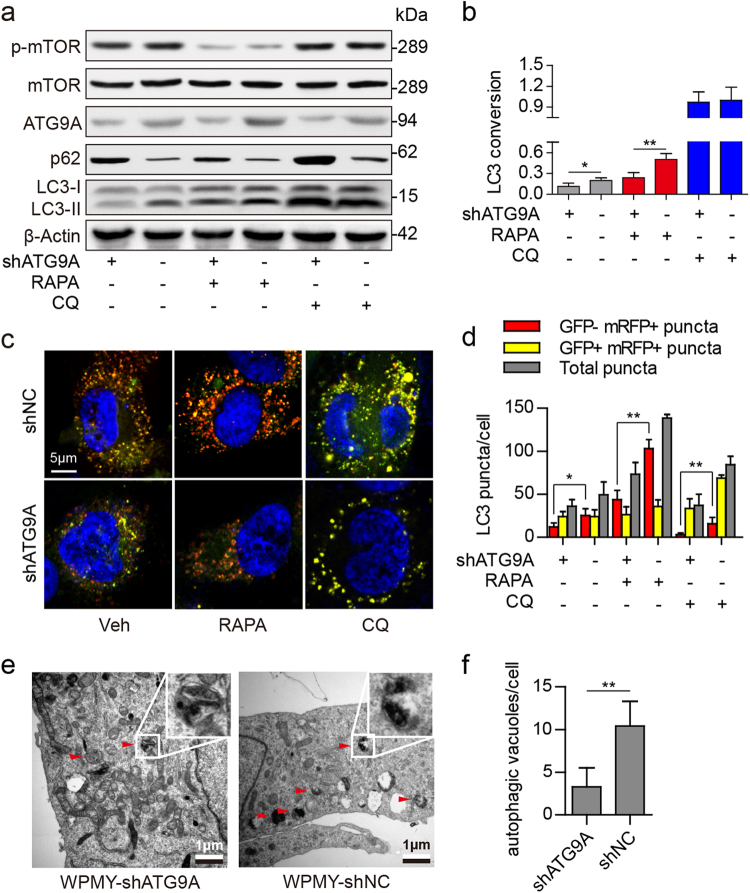
Fig. 5. Autophagy in prostate stromal fibroblasts after ATG9A knockdown.
a, b Western blot data showing phospho-mTOR (p-mTOR), mTOR, ATG9A, and p62 protein expression levels and the LC3 conversion ratio (LC3-II/β-Actin) in WPMY-1 cells after ATG9A knockdown. The cells were treated with 50 nM RAPA or 50 μM CQ for 3 h before protein extraction. c, d ATG9A knockdown WPMY-1 cells were infected with mRFP–GFP–LC3 adenovirus for 48 h, and treated with 50 nM RAPA or 50 μM CQ for 3 h before 4% paraformaldehyde fixation and DAPI counterstaining. Scale bar, 5 μm. Bar graphs showing LC3 puncta formation in different groups. e, f Transmission electron micrographs for autophagic vacuoles detection in ATG9A knockdown WPMY-1 (WPMY-shATG9A) or control (WPMY-shNC) cells. The cells were treated with 50 nM RAPA for 3 h before 2% glutaraldehyde fixation. Enlarged images show double-membrane autophagic vacuoles. Scale bar, 1 μm. *P < 0.05, **P < 0.01

