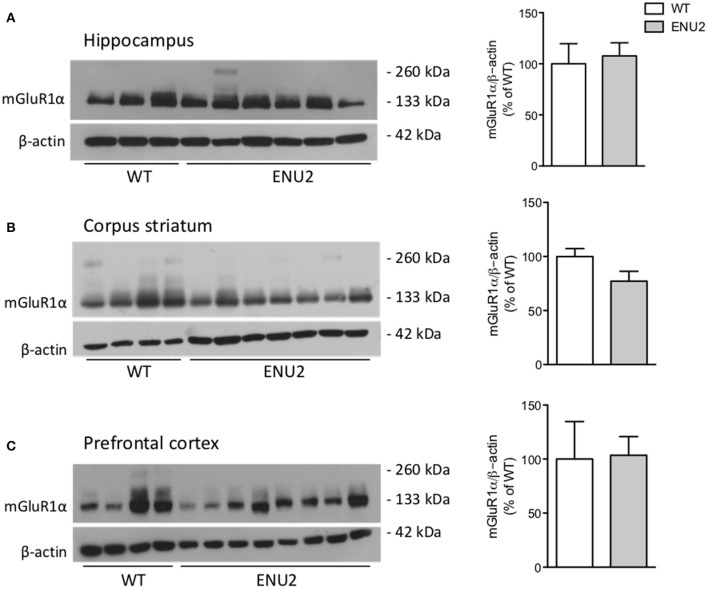
Figure 1.
No changes in mGlu1α receptor protein levels in the hippocampus (A), corpus striatum (B), and prefrontal cortex (C) of ENU2 mice. All samples from the hippocampus and prefrontal cortex of ENU2 and WT mice are shown in the immunoblots in (A,C), respectively. A representative immunoblot of striatal samples is shown in (B). Values are means ± S.E.M. of 3 WT and 6 ENU2 mice in (A); 10 WT and 14 ENU2 mice in (B); and 4 WT and 8 ENU2 mice in (C).

