
FIGURE 6.
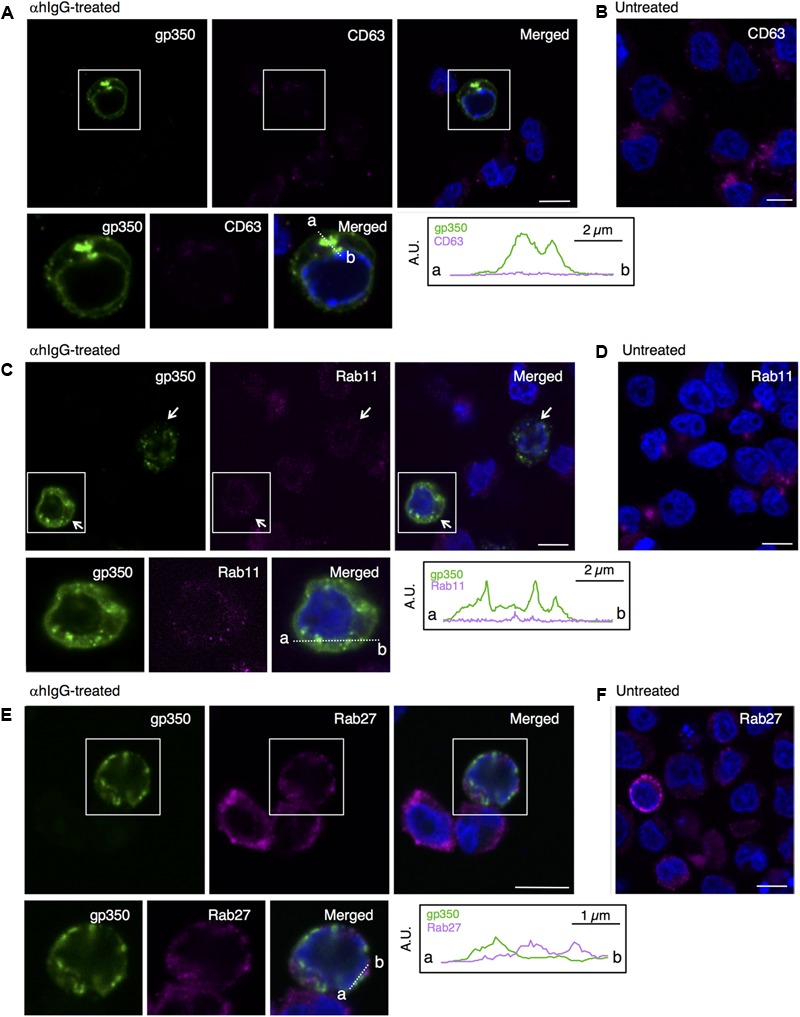
EBV glycoprotein does not colocalize with endosomal markers. The distribution of the EBV glycoprotein and markers of endosomes in Akata+ cells induced into the lytic cycle. Akata+ cells were treated with (A,C,E) or without αhIgG (B,D,F) for 16 h. (A) The distribution of gp350/220 (left), CD63 (middle) and merged (right) images are shown. As a control, the distribution of CD63 in the untreated cells is shown in (B). (C) The distribution of gp350/220 (left), Rab11 (middle) and merged (right) are shown. As a control, the distribution of Rab11 in the untreated cells is shown in (D). (E) The distribution of the EBV capsid antigen, gp350/220 (left) and Rab27a (middle) and merged (right) images are shown. As a control, the distribution of Rab27a in the untreated cells is shown in (F). The nuclei (blue) were counterstained with Hoechst 33342. Insets show the boxed areas. The plots indicate the individual fluorescence intensity along each of the corresponding lines. A.U., arbitrary unit. Scale bars: 10 μm.