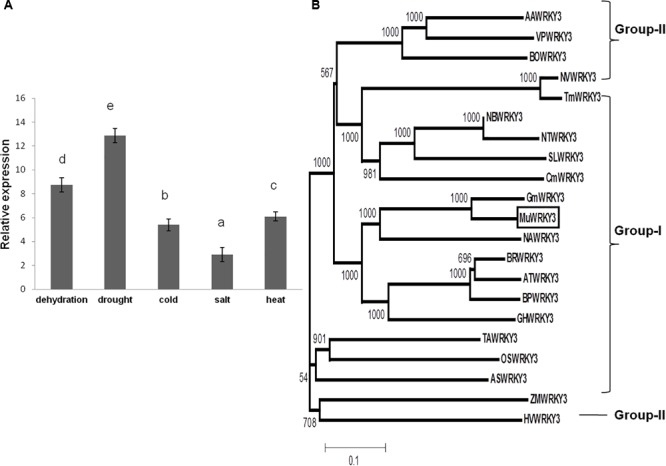
FIGURE 1.

(A) Expression of MuWRKY3 in horsegram under various abiotic stresses as determined by real-time PCR analysis. Error bars represent standard deviations (SD) for three independent replicates with different letters at P < 0.05 significant level. (B) Unrooted Bootstrapped Neighbor Joining tree analysis of MuWRKY3 and WRKY protein sequences from different species. The amino acid sequences of the conserved WRKY domain region were aligned using ClustalX version 2.1. MuWRKY3 is boxed in the figure (Supplementary Figure S5).
