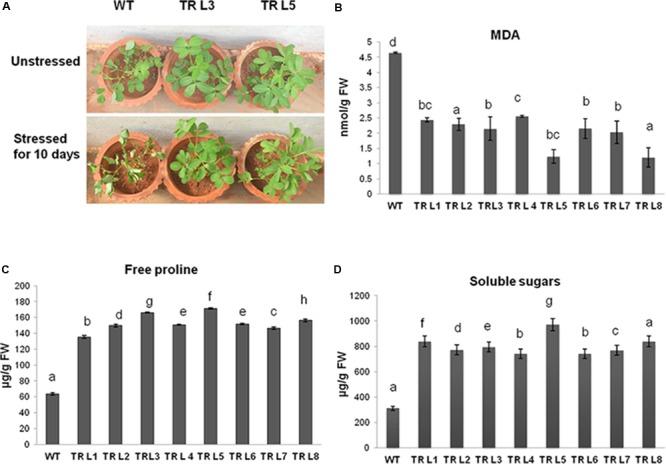
FIGURE 4.

(A) Phenotypic differences in transgenic lines and WT groundnut plants under unstressed and drought stressed for 10 days. (B) MDA content in WT and transgenic plants under stress. (C) Free proline content and (D) total soluble sugars in transgenic and WT plants under drought stress conditions (WT- WT, TRL1 to TRL8 – Transgenic lines). Data is analyzed using SPSS version 16.0, values shown is the mean of three replicates and ±SE of three replicates and letters shown above the bars are significantly different at P < 0.05 (DMR).
