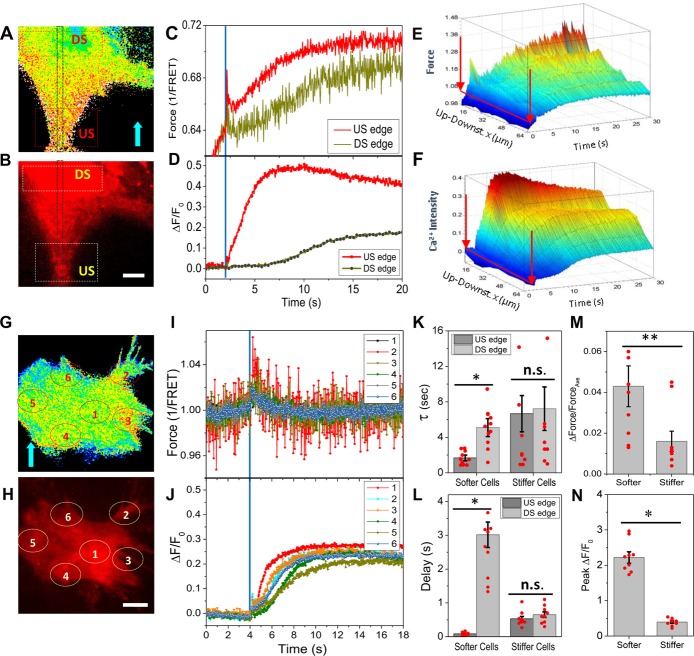
Figure 2.
Simultaneously measured forces and intracellular Ca2+ in response to shear pulses. (A,B) Typical force map generated with actinin-cpstFRET probes and Ca2+ with Rhd-2 in a soft cell. (C,D) Changes of forces and Ca2+ in response to a rapid shear pulse (23 dyn/cm2, 400 ms, indicated by blue lines), showing Ca2+ rise began at the upstream end of the cell where there was higher force. (E,F) 3D map of evolution of forces and Ca2+ along a strip (gray window in A,B), showing the Ca2+ propagating as a wave from upstream to downstream of the cell. (G–J) Typical force (G,I) and Ca2+ responses (H,J) to the same shear pulse in a stiffer cell, showing a small uniform transient change in force and small Ca2+ rise. (K,L) The Ca2+ increase is faster with little latency at the upstream edge compared with downstream edge in the softer cells, but it was slower with delay in stiffer cells (n = 11, softer cells; n = 9, stiffer cells). *p < 0.005. (M,N) Statistical analysis shows the force gradients and peak Ca2+ are higher in the softer cells. **p < 0.05. Error bars indicate SEM. Scale bars indicate 10 μm.

