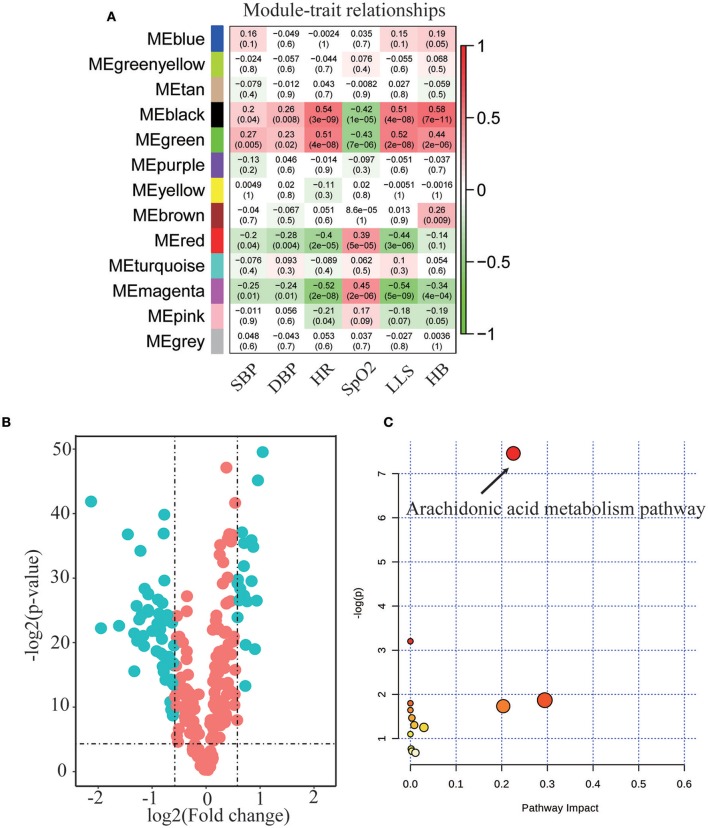
Figure 2.
Metabolic profiling analysis in response to acute hypoxia exposure. (A) WGCNA analysis identified four connectivity-based modules with high correlation to clinic features of heart rate (HR), oxygen saturation (SpO2), Lake Louise score (LLS), systolic blood pressure (SBP), diastolic blood pressure (DBP), and hemoglobin (HB). High correlation values are indicated by red and negative correlations, in green color. (B) Comparison of all metabolites from plasma of subjects before and after hypoxia exposure. The volcano plot displays the relationship between fold change and significance using a scatter plot view. The green points in the plot represent the differential metabolites with statistical significance. (C) Enrichment pathway analysis for the dominant metabolites identified in the volcano plot before and after hypoxia exposure.

