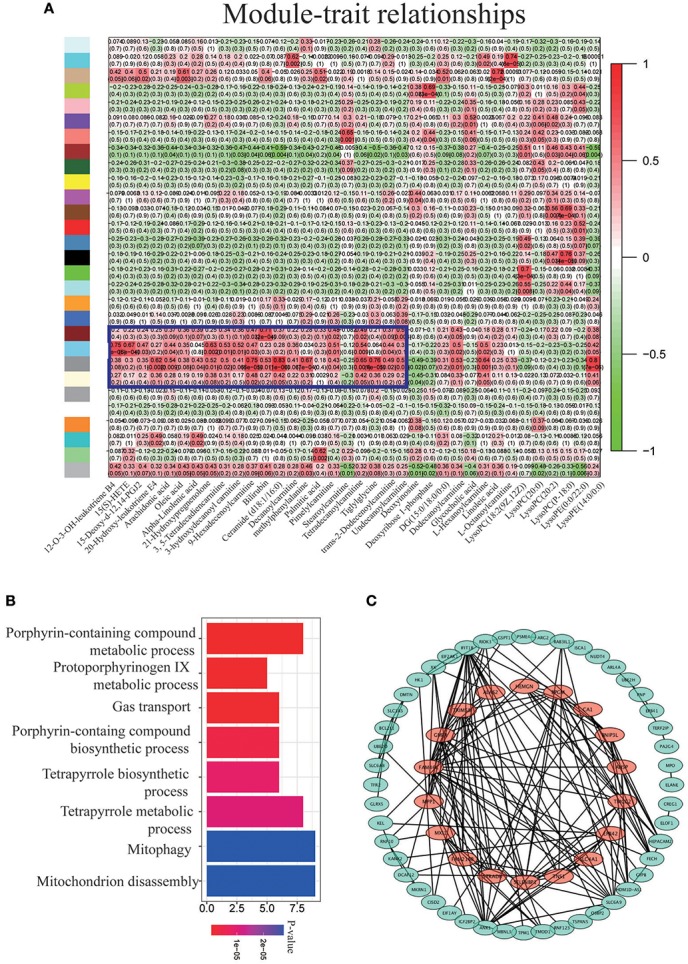
Figure 3.

Integrated analysis of metabolomic and transcriptomic profiling. (A) Unsupervised hierarchical cluster of correlation coefficients (kME and normalized metabolite values). High correlations are colored in red and low correlations, in green. (B) GO analysis for the modules inside the violet frame. (C) Network visualization of genes with high correlations to the AA metabolism pathway.
