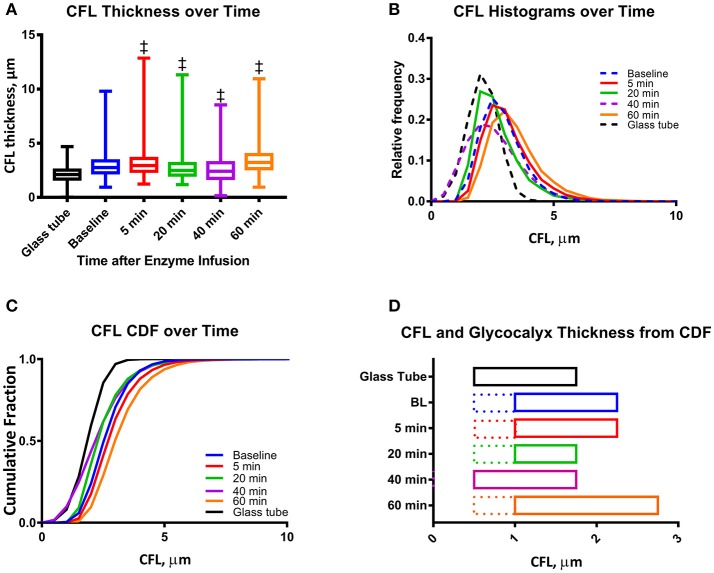
Figure 3.
Mean CFL thickness during enzymatic degradation of the EGL: (A) CFL thickness over time after enzyme infusion. The changes in the mean CFL were found to be statistically significant (‡P < 0.05) at all-time points. (B) Histograms of CFL thickness over time after enzyme infusion. For individual histograms, see Supplemental Figure 2. (C) Cumulative distribution functions (CDF) of CFL thickness over time after enzyme infusion. (D) One tailed 99% confidence interval of CFL over time after infusion. The left hand bound was determined as the point on the CDF at which P < 0.01, and the right hand bound was determined as the inflection point of the CDF (see Supplemental Figure 1). The thickness of the EGL (indicated as dotted line) was approximated by correcting the CFL distributions with that measured for a glass tube, in which only fluid hydrodynamic forces are present. (‡P < 0.05) compared to baseline.

