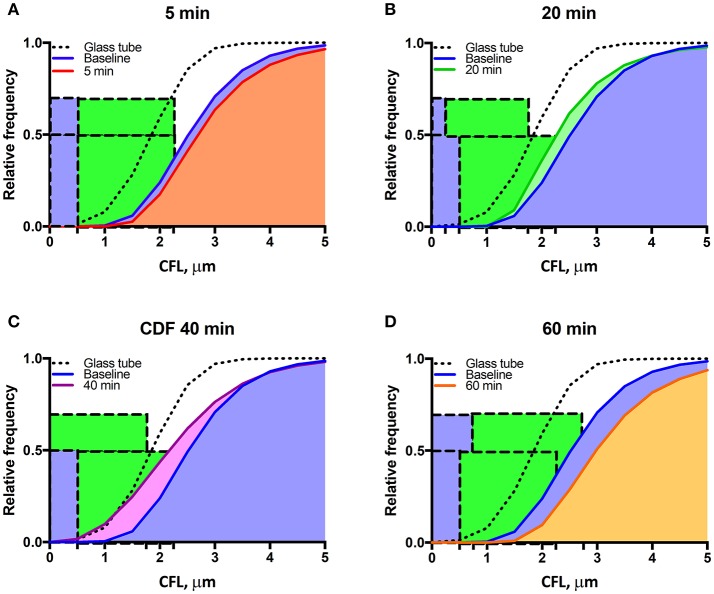
Figure 4.
Mean cumulative distribution function during enzymatic degradation of the EGL: CDFs at baseline and at (A) 5 min, (B) 20 min, (C) 40 min, and (D) 60 min after enzyme infusion. The blue bonding box represents the approximated thickness of the glycocalyx, and the green bounding box represents the one-tailed 99% confidence interval of the CFL thickness.

