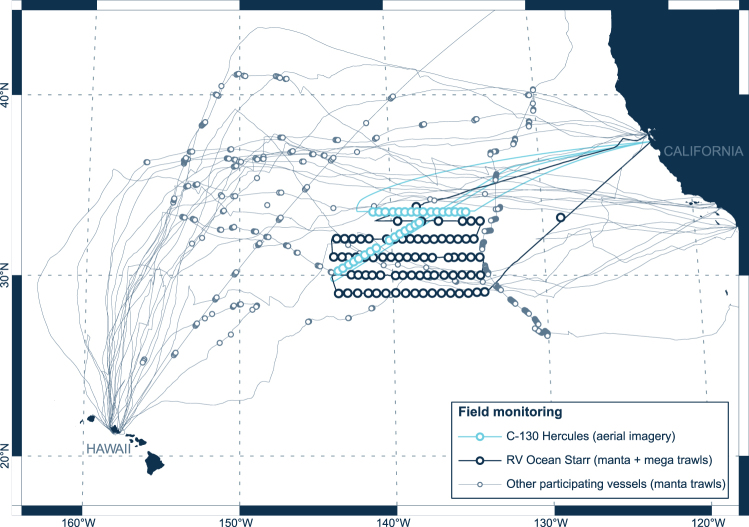
Figure 1.
Field monitoring effort. Vessel (grey and dark blue lines) and aircraft (light blue lines) tracks and locations where data on buoyant ocean plastic concentrations were collected (circles). Grey circles (n = 350) represent areas sampled with a single Manta net tow by 17 participating vessels, between July and September 2015. Dark blue circles (n = 76) represent areas sampled with paired Manta and paired Mega net tows by RV Ocean Starr, between July and August 2015. Light blue circles (n = 31) show locations of RGB geo-referenced mosaics collected from a C-130 Hercules aircraft, in October 2016. This map was created using QGIS version 2.18.1 (www.qgis.org).

