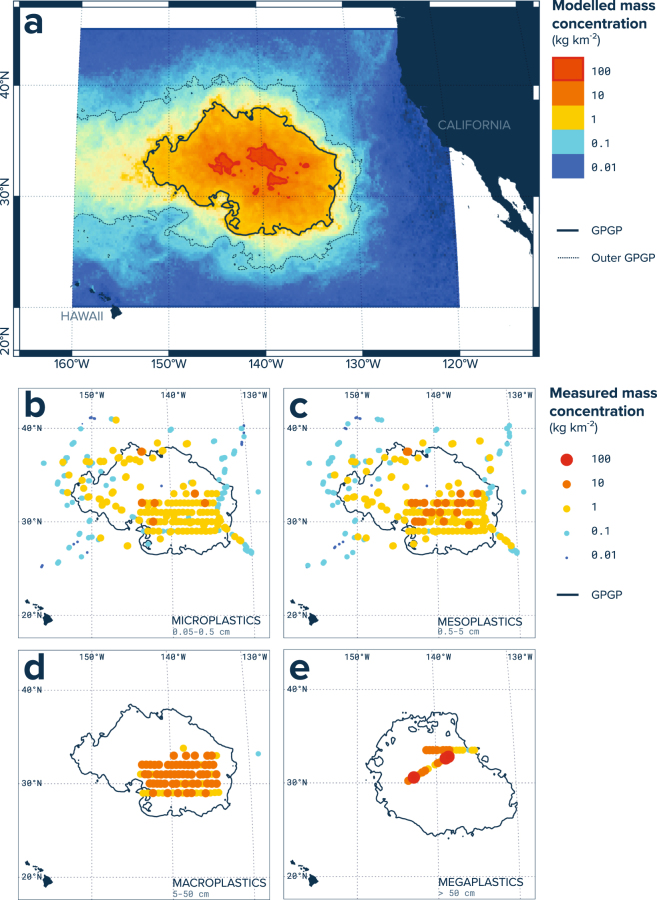
Figure 3.
Modelled and measured mass concentration in the Great Pacific Garbage Patch (GPGP). (a) Ocean plastic mass concentrations for August 2015, as predicted by our data-calibrated model. The bold black line represents our established limit for the GPGP. (b) Microplastics (0.05–0.5 cm) mass concentrations as measured by Manta trawl (n = 501 net tows, 3.8 km2 surveyed). (c) Mesoplastics (0.5–5 cm) mass concentrations as measured by Manta trawl; d) Macroplastics (5–50 cm) mass concentrations as measured by Mega trawl (n = 151 net tows, 13.6 km2 surveyed); (e) Megaplastics (>50 cm) mass concentrations as estimated from aerial imagery (n = 31 mosaic segments, 311.0 km2 surveyed). All observational maps are showing mid-point mass concentration estimates as well as the predicted GPGP boundaries for the corresponding sampling period: August 2015 for net tow samples, and October 2016 for aerial mosaics. Maps were created using QGIS version 2.18.1 (www.qgis.org).

