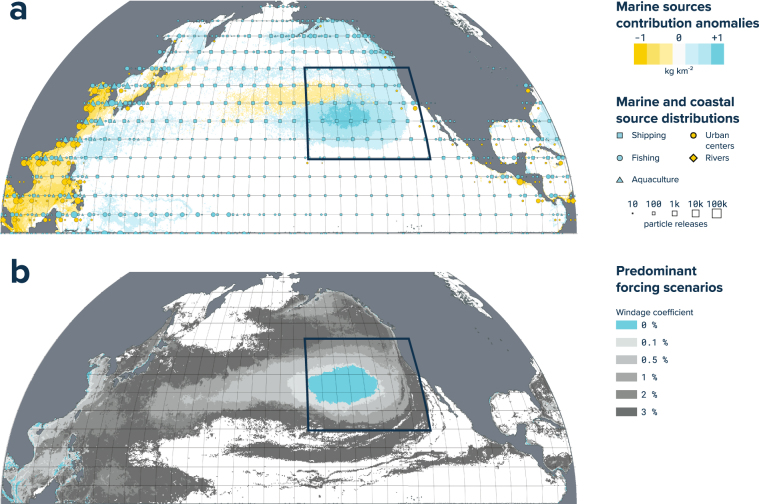
Figure 5.
Modelled source and forcing distributions. (a) North Pacific distribution of the ocean plastics sources used in this study (blue and orange squares, circles and triangles), and predicted marine source (shipping, fishing and aquaculture) anomalies in relation to the initial distribution of both marine- and land-based sources (coastal urban centres and rivers). (b) Predicted North Pacific distribution of dominant forcing scenario. Windage coefficient values correspond to the percentage contributions of wind forcing at 10 m above sea level. Maps were created using QGIS version 2.18.1 (www.qgis.org).

