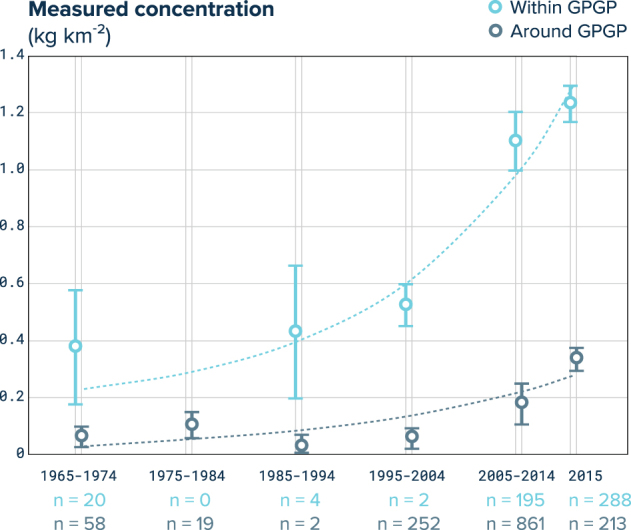
Figure 6.

Decadal evolution of microplastic concentration in the GPGP. Mean (circles) and standard error (whiskers) of microplastic mass concentrations measured by surface net tows conducted in different decades, within (light blue) and around (dark grey) the GPGP. Dashed lines are exponential fits to the averages expressed in g km−2: f(x) = exp(a*x) + b, with x expressed in number of years after 1900, a = 0.06121, b = 151.3, R2 = 0.92 for within GPGP and a = 0.04903, b = −7.138, R2 = 0.78 for around the GPGP.
