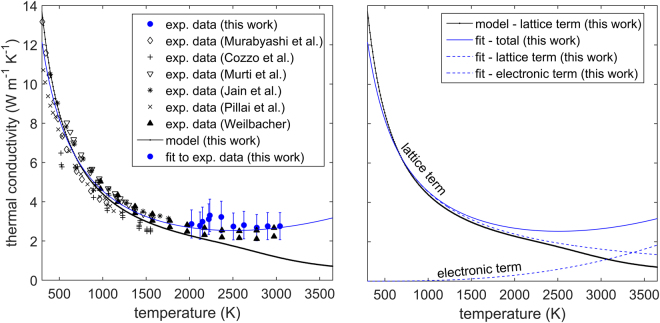
Figure 11.
(A) Thermal conductivity as a function of temperature measured in this work compared to: the experimental data of Murabayashi14, Cozzo et al.13, Murti et al.25, Jain et al.26, Pillai et al.24, Weilbacher15, the current model results and the fit proposed in this work. (B) The lattice term of thermal conductivity calculated by the model compared to the lattice and electronic terms obtained from the fit (the word model refers to the mechanistic approach used to calculate lattice thermal conductivity, which has been described previously18). Error bars correspond to a relative error of two standard deviations.

