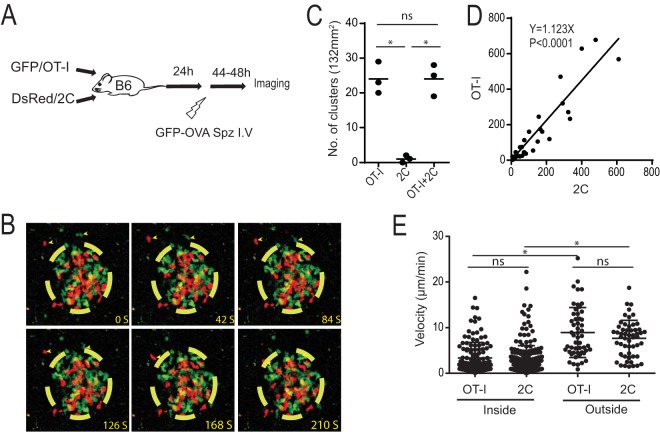
FIG 1.
Both antigen-specific and nonspecific CD8+ T cells join clusters around infected hepatocytes. (A) Experimental design of two-photon imaging of antigen-specific (GFP/OT-I) and nonspecific (DsRed/2C) CD8+ T cells in the liver after sporozoite infection. (B) Time-lapse two-photon images of OT-I cells (green) and 2C cells (red) in a cluster formed in the liver. The yellow-dashed circle shows the arbitrary border of a cluster. Arrowheads indicate OT-I and 2C cells outside the cluster moving toward the cluster. (C) Numbers of clusters in 132-mm2 image fields from the livers of mice treated with OT-I, 2C, or both OT-I and 2C cells (n = 3 mice/group). Each dot represents data for one mouse. *, P < 0.05; ns, not significant (by one-way ANOVA followed by Sidak's multiple-comparison tests). (D) Numbers of OT-I and 2C cells located inside each cluster. Each dot represents data for one cluster (P < 0.0001 by Spearman's rank correlation coefficient). (E) Velocities of OT-I and 2C cells inside and outside clusters. Each dot represents data for one CD8+ T cell. Data are derived from five experiments with similar results. *, P < 0.05; ns, not significant (by two-way ANOVA followed by Sidak's multiple-comparison tests).

