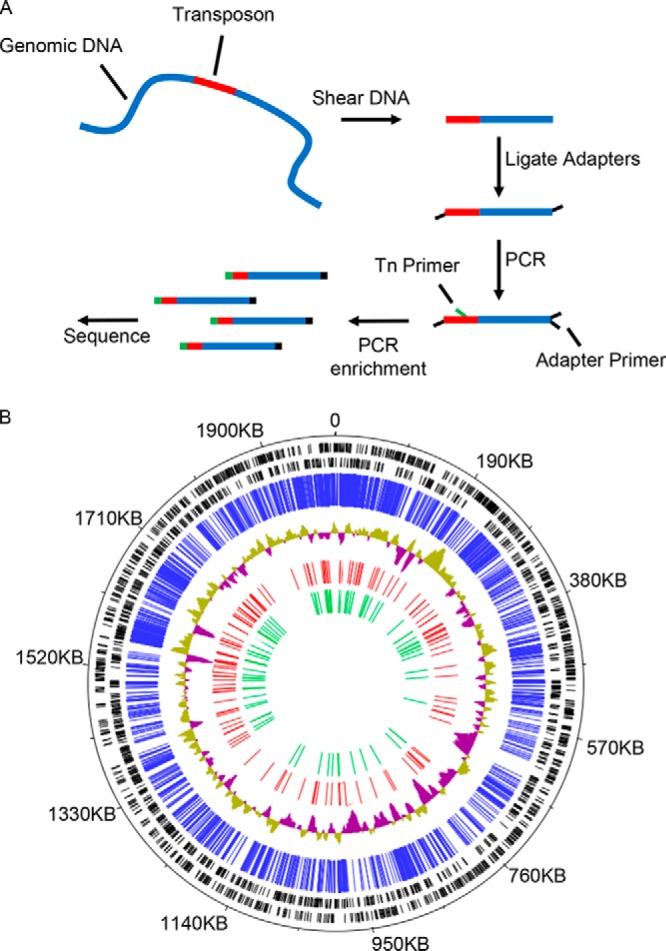
FIG 1.

Sequencing and mapping of transposon mutant library by insertion sequencing. (A) A graphical depiction of the preparation of DNA for sequencing and mapping of the C. burnetii transposon insertion mutant library. (B) C. burnetii RSA493 genome annotated with the location of transposon insertion sites that were mapped by INSeq analysis. The black bars indicate the locations of predicted open reading frames encoded on forward and reverse strands. The blue bars indicate the location of each transposon insertion site in the mutant library that was identified and mapped by INSeq analysis. The blue and green topology graph depicts G-C content of the chromosomal DNA. The red bars indicate the relative locations of all predicted T4E genes. The green bars indicate the location of transposon insertion sites in predicted effector genes where the mutants were isolated and validated to construct the T4E mutant sublibrary.
