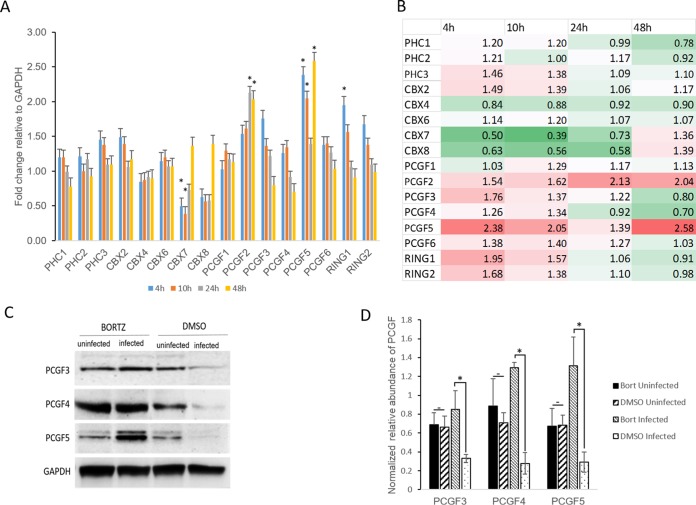
FIG 4.
Decrease in PCGF isoforms occurs via proteosomal degradation in E. chaffeensis-infected cells. (A) Graph representing fold changes in PRC1 core component gene expression in E. chaffeensis-infected cells at 4, 10, 24, and 48 hpi; n = 3. Biologically significant (approximately ≤2-fold increase or decrease) and statistically significant (Student's two-tailed t test; *, P ≤ 0.05) changes in gene transcription were observed for CBX7, PCGF2, PCGF5, and RING1 genes. (B) Heat map showing relative expression levels of PRC1 core component genes at 4, 10, 24, and 48 hpi. Each position in the heat map represents an individual gene (listed next to the heat map). The colors indicate differential expression (red indicates induction, green indicates repression, and white represents no significant change) from the average gene expression level in uninfected cells. The intensity of the color represents the amplitude of induction/repression. (C) Western blot analysis of bortezomib (BORTZ)- or DMSO-treated THP-1 (E. chaffeensis-infected and uninfected) whole-cell lysates using isoform-specific anti-PCGF antibodies. E. chaffeensis-infected or uninfected THP-1 cells were treated with 100 nM bortezomib 38 h postinfection for 10 h. The whole-cell lysates were then subjected to SDS-PAGE separation, and the relative abundance of PCGF isoforms was determined using chemiluminescence. (D) Graph representing GAPDH-normalized relative abundance of PCGF isoforms in bortezomib- or DMSO-treated E. chaffeensis-infected or uninfected THP-1 cell lysates. Error bars indicate standard deviations between experiments (n = 3; Student's two-tailed t test; *, P ≤ 0.05).

