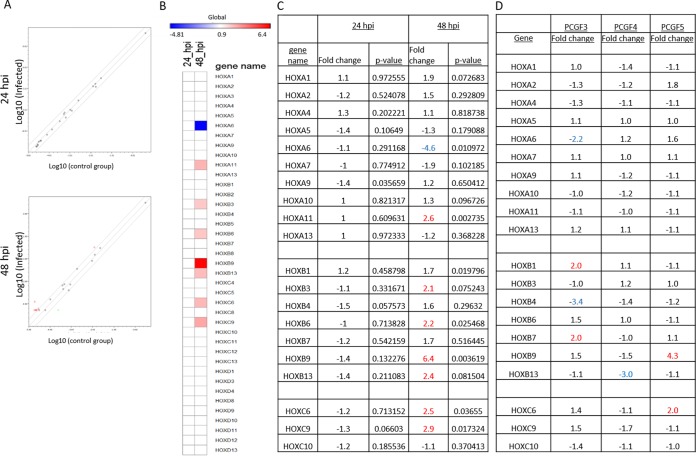
FIG 5.
E. chaffeensis infection alters Hox gene expression. (A) Scatterplot analysis of PCR array results shows the differentially expressed genes between E. chaffeensis-infected and uninfected THP-1 cells at 24 (top panel) and 48 (bottom panel) hpi. Red dots represent upregulation, a black dot represents no significant change of expression, and green dots represent downregulation. The graph shows the logarithmic values of average gene expression under either condition. (B) Heat map showing relative expression levels of Hox genes at 24 (left column) and 48 (right column) hpi. Each position in the heat map represents an individual Hox gene (listed next to the heat map). The scale bar intensity demonstrates differential expression (red indicates induction, blue indicates repression, and white represents no significant change) from the average gene expression level in uninfected cells. The intensity of the color represents the amplitude of induction/repression. (C) List of Hox genes in which transcript levels were detected in at least any one of the conditions, i.e., uninfected and 24 and 48 hpi. Seven out of 20 transcriptionally active Hox genes showed a biologically significant (P ≤ 0.05) increase (≥2-fold increase; red) in their transcript levels compared to the control. (D) PCR array results demonstrating differential Hox gene expression in PCGF3 (left)-, PCGF4 (middle)-, and PCGF5 (right)-silenced THP-1 cells. Knockdowns were performed individually one at a time, and biologically significant changes (≥2-fold increase or decrease) in gene expression are color coded (red, increase; blue, decrease).

