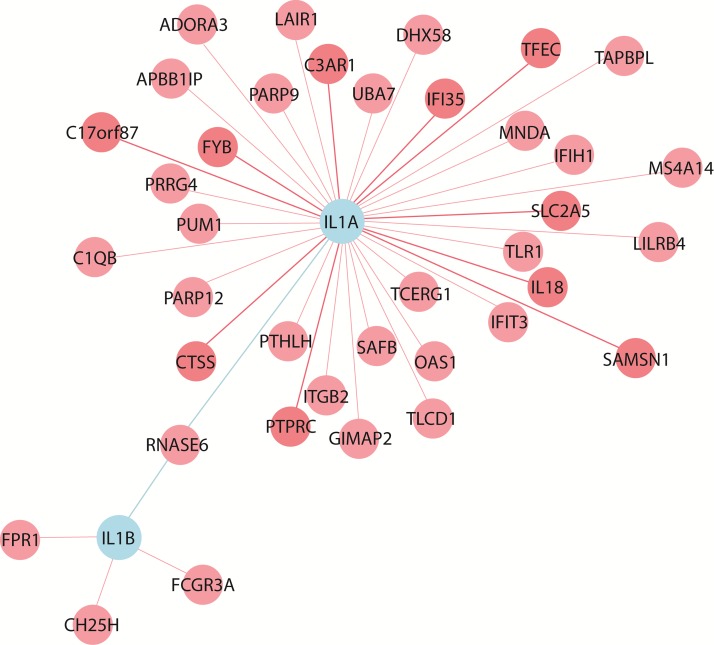
FIG 1.
Coexpression analysis of IL-1α, IL-1β, TNF-α, IFN-γ, and IL-10, using NP de novo coexpression analysis (http://www.wzgenomics.cn/NPdenovo/index.php). The reference data set was HBT (The Human Brain Transcriptome), the minimum Pearson correlation coefficient was 0.8, and the maximum number of nodes of the network was 80.

