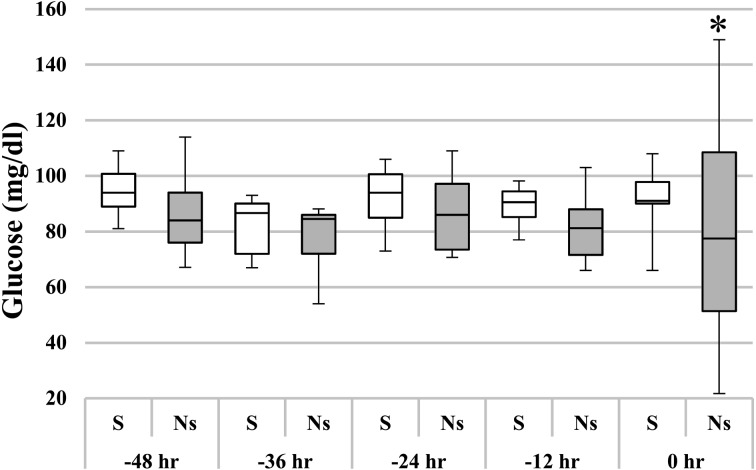
Fig. 2.
Changes in blood glucose in horses with acute colitis with SIRS, counted backward from an outcome point (0 hr) in time. The center line is the median; interquartile ranges and maximum and minimum values are represented by boxes and whiskers. In the non-survivor group, the blood glucose concentration changed markedly between –12 hr and 0 hr. *Outcome significantly different (P<0.05; F-test) from that in the survivor group. S, survivor group; Ns, non-survivor group.

