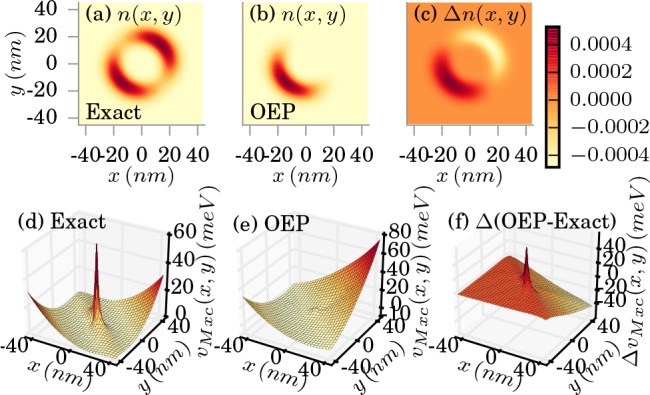
Figure 4.

Exact (a) and OEP approximated (b) electron density in the strong-coupling limit (λα = 0.1342 meV1/2/nm). The difference is shown in (c). The corresponding xc potentials are shown in (d) and (e), respectively, (f) shows the difference in the xc potentials.
