
FIGURE 1.
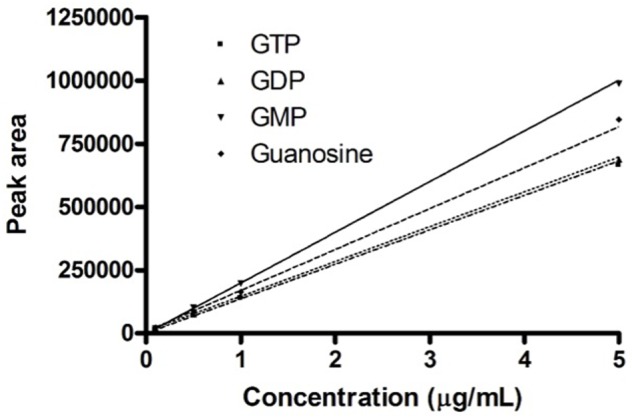
Calibration curves. Calibration curves obtained for the four guanosine-based analytes. The graph shows the concentrations of guanosine-based molecules and the relative peak area measured on the developed HPLC procedure.
Official websites use .gov
A
.gov website belongs to an official
government organization in the United States.
Secure .gov websites use HTTPS
A lock (
) or https:// means you've safely
connected to the .gov website. Share sensitive
information only on official, secure websites.
Calibration curves. Calibration curves obtained for the four guanosine-based analytes. The graph shows the concentrations of guanosine-based molecules and the relative peak area measured on the developed HPLC procedure.