. 2018 Jan-Mar;7(1):16–20. doi: 10.4103/sajc.sajc_196_17
Copyright: © 2018 The South Asian Journal of Cancer
This is an open access article distributed under the terms of the Creative Commons Attribution-NonCommercial-ShareAlike 3.0 License, which allows others to remix, tweak, and build upon the work non-commercially, as long as the author is credited and the new creations are licensed under the identical terms.
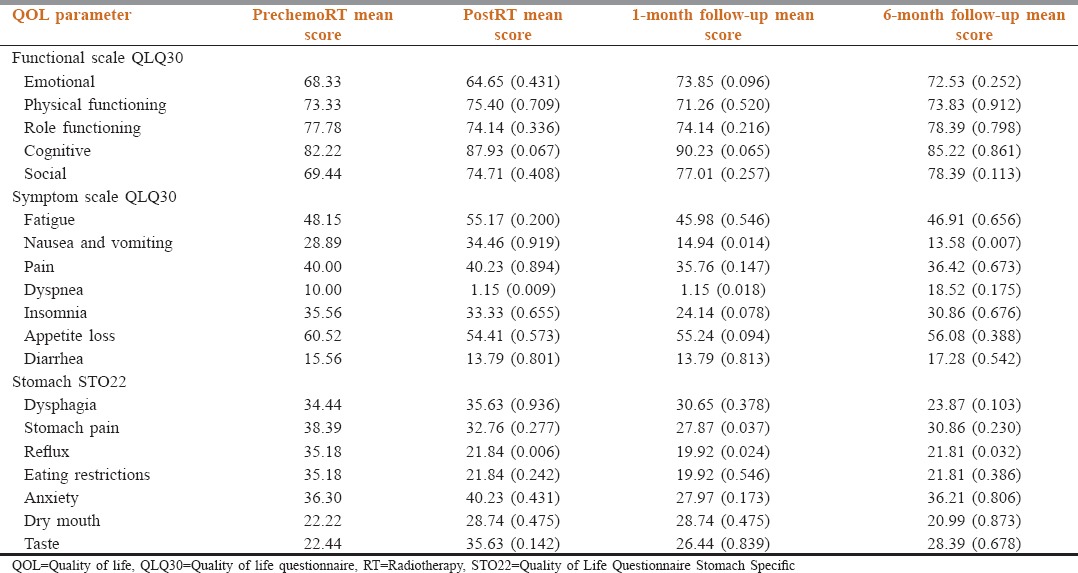
Table 2.
Quality of life scores at various time points

