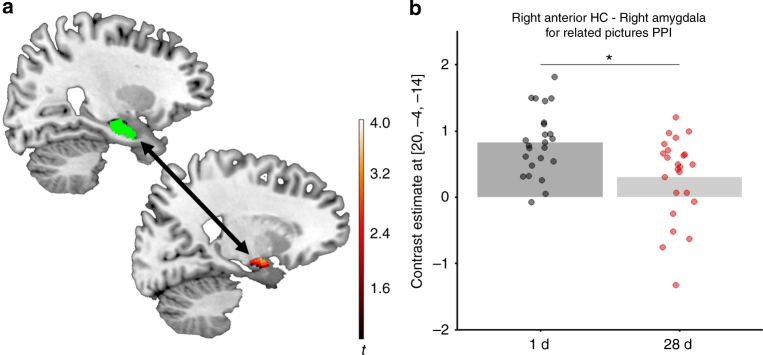
Fig. 3.
Connectivity with amygdala. a Visualization of the connectivity between right aHC and right amygdala. Green represents the anatomical right aHC mask; red represents activation in the right amygdala for the contrast 1 d > 28 d of PPI interactions for related pictures with the right aHC as seed. Visualizations are superimposed on sagittal sections of a T1-weighted template image. b Parameter estimates in the peak voxel in the right amygdala. The right aHC showed a reduced connectivity to the right amygdala in the 28 d group compared to the 1 d group for related pictures (SVC peak level: x = 20, y = −4, z = −14, t = 3.59, p(FWE) = 0.0156, k = 15), but not for old or novel pictures. Note that neither using the left aHC nor the pHC (left or right) as seed regions, nor looking at other ROIs resulted in significant group differences in connectivity. See also Supplementary Table 3. *p < 0.05

