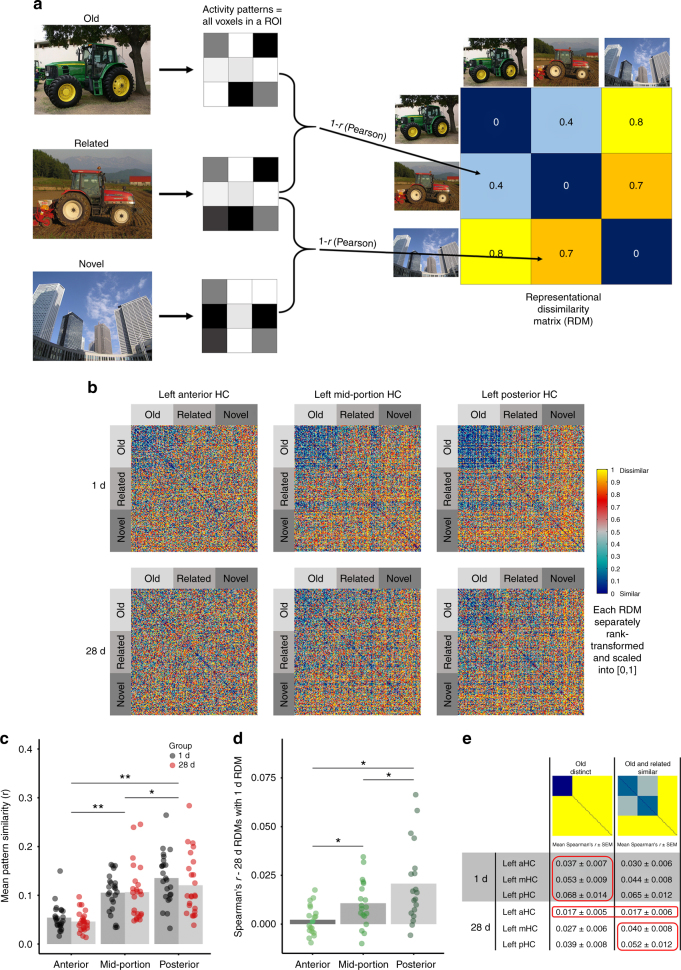
Fig. 4.
Representational similarity analysis for the left HC long axis ROIs. a Schematic overview of the creation of a representational dissimilarity matrix (RDM; for illustration purposes only 3 pictures) modified from ref. 48. Images courtesy of Andreas Praefcke (green tractor), Akiyoshi’s Room (red tractor) and Morio (skyscrapers). b The group average RDMs of the left long axis hippocampal ROIs (1 d group in the first row, 28 d group in the second row). Blue colors = most similar, bright colors = most dissimilar; note that for the visualizations each RDM was separately rank transformed and scaled into [0, 1]. c Comparison of mean pattern similarities (Pearsons r) across ROIs: the mean similarity in the hippocampal subregions differed significantly. Note that all n = 48 participants are included here. d Comparison between groups: correlations (Spearman's r) of each single-subject RDM of the 28 d group to the respective average RDM of the 1 d group. The correlations between the two groups differed significantly in the three ROIs. Note that the data in b and d are from only 40 participants (1 d group = 21, 28 d group = 19) as the remaining eight participants had different sized RDMs and could therefore not be included in the average RDM for the group comparisons. e Comparison with two model RDMs: each cell in the table shows the mean of the correlations (Spearman's r + SEM) of the single-subject brain RDMs with the respective model RDM (first three rows = 1 d group, last three rows = 28 d group; n = 48). For each ROI the model with the higher correlation was marked by a red frame, in case of very similar correlations both values were marked. In the 1 d group, the “Old Distinct” model showed trends toward a better fit. In the 28 d group the “Old and Related Similar” model had a better fit in the mHC and a trend toward a better fit in the pHC, while in the aHC both models were indistinguishable and the model fits were generally rather low. For analysis of the right HC long-axis ROIs see Supplementary Fig. 8. *p < 0.05, **p < 0.001

