Figure 4.

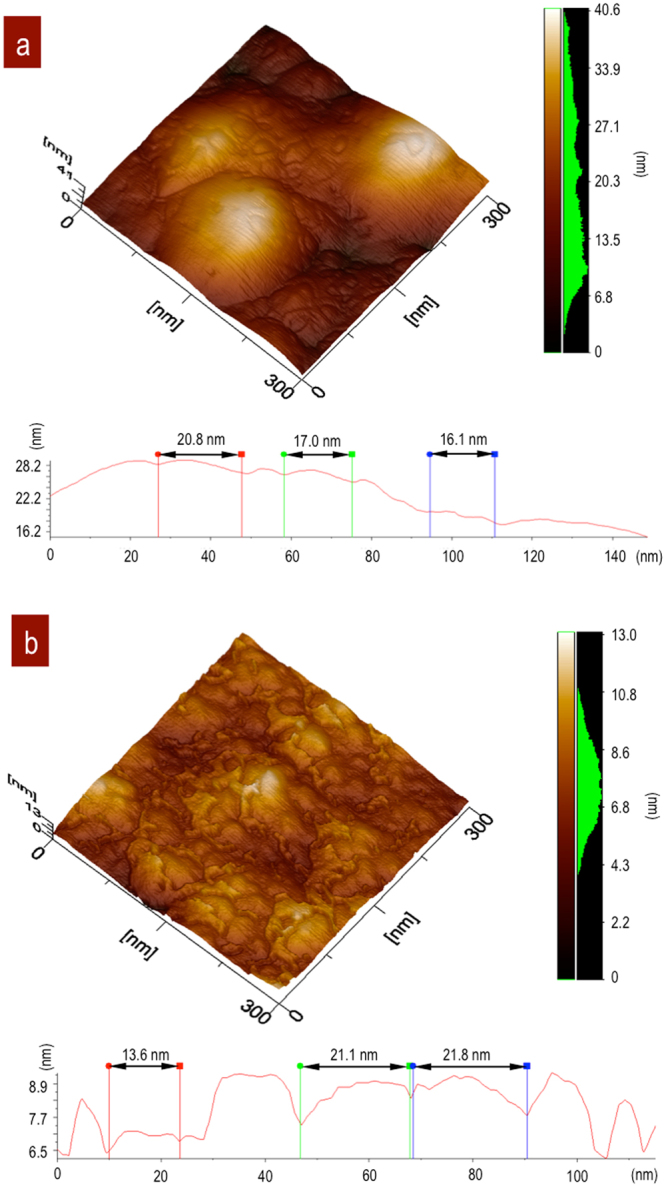
Topography by AFM. (a) Fe3O4 NPs immersed in a SiO2 matrix after 4 h of stirring. (b) 12 h of stirring with a high concentration of NPs. Profiles show isolated Fe3O4 NPs signals from (a) SSD at 4 h and agglomeration at 12 h (b).

Topography by AFM. (a) Fe3O4 NPs immersed in a SiO2 matrix after 4 h of stirring. (b) 12 h of stirring with a high concentration of NPs. Profiles show isolated Fe3O4 NPs signals from (a) SSD at 4 h and agglomeration at 12 h (b).