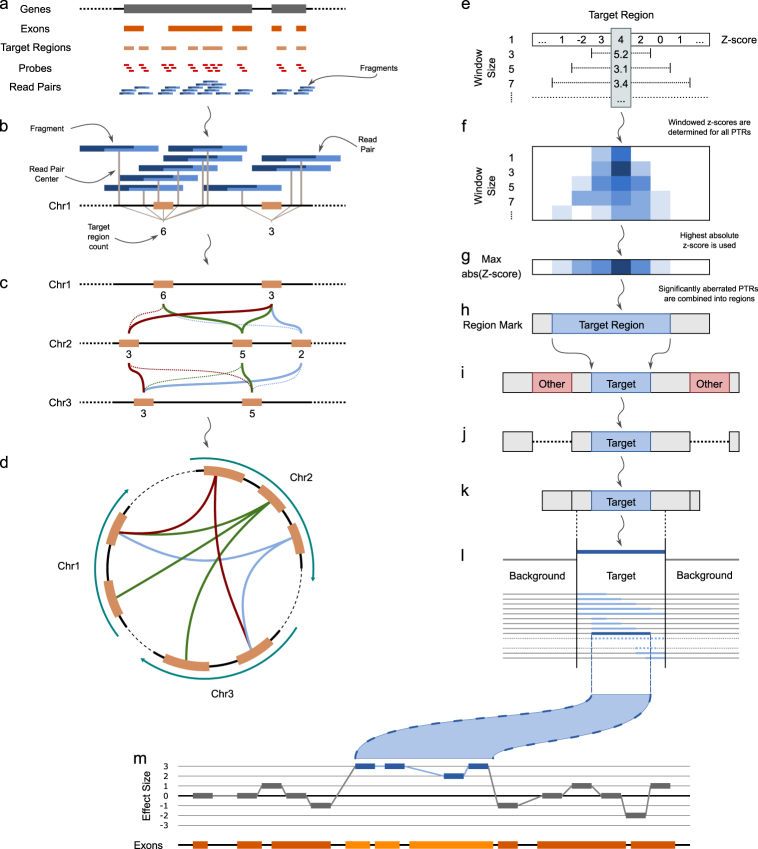
Fig. 1.
a Overview of all regions of importance for WES data. Genes (gray boxes) consist of exons (orange boxes), which are covered by target regions (light orange boxes), for which probes are designed (red boxes) that target a unique sub-sequence of the fragment. Paired-end reads (blue boxes) cover fragments. b Determination of target region read count: a detected fragment is mapped on the reference genome, and consequently assigned to the nearest target region (orange box) based on the center of the fragment (gray lines). c Selection of reference target regions based on the difference in read counts over a set of training samples. For illustrative purposes, we show only one sample and a few target regions on three different chromosomes. The selected reference target regions for the target regions on chromosome 2 are indicated by the straight colored lines. In this example, only reference target regions are considered when the read count differs at most 1 read. Dotted lines are tested but showed a larger difference. d Schematic overview of the selected reference target regions for the target regions on chromosome 2 as shown in c. e Based on its reference set, a z-score for every target region can be calculated (level window size 1). Z-scores of neighboring target probes are aggregated using a combined z-score (here Stouffer’s z-score) for different numbers of neighbors, using odd window sizes from 3 to 15. f Target regions with a significant z-score in any of the windows are marked and kept for further analysis (blue shaded boxes). g For every target region, a final z-score is determined by taking the maximal (positive or negative) z-score across all window sizes (at the target region position). h Stretches of significantly aberrated target regions (blue shaded boxes) are marked as a putative CNV segment. i, j, k To fine-tune the borders of the CNV, the putative CNV segment is considered with all non-putative CNV regions on the same chromosome (i shows the extension, j prunes the putatively aberrated CNVs, k is the result). l To find the exact borders of the CNV, the location of borders of the putative CNV are changed over all possible positions within and directly neighboring the putative CNV region (shaded blue lines in l). The segment that shows the largest difference in mean effect size within the segment compared to the mean effect size outside the segment is selected as the aberrated CNV segment (dark blue line in l). m For visualization purposes, the z-scores (vertical axis) for each target region are plotted across their genomic position (x-axis). Designated aberrated target regions (regions within a detected CNV segment) are colored blue, others gray. The bottom line shows the position of the exons (orange boxes).

