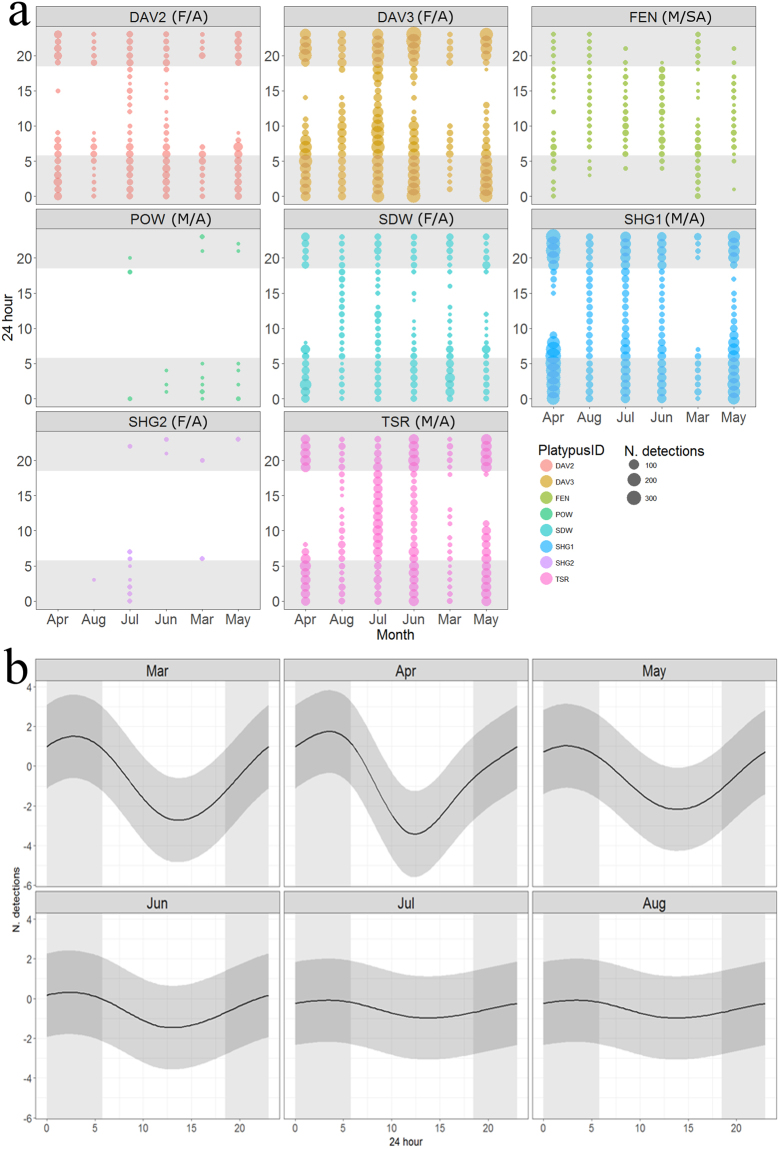
Figure 2.
(a) Observed number of detections (size of circle) at each hour (24 hr), March-August, panelled and coloured by individual platypuses (see Table 1 for IDs) and (b) estimates of circadian activity (number of detections) at each hour during each month, based on the Generalized Additive Mixed-Effect Model, which indicated significant associations between activity and time of day, March-June but not July-August (see Appendix 2 for model outputs). Average sunrise\sunset times March to August (5:47/18:29) indicated by grey background shading.

