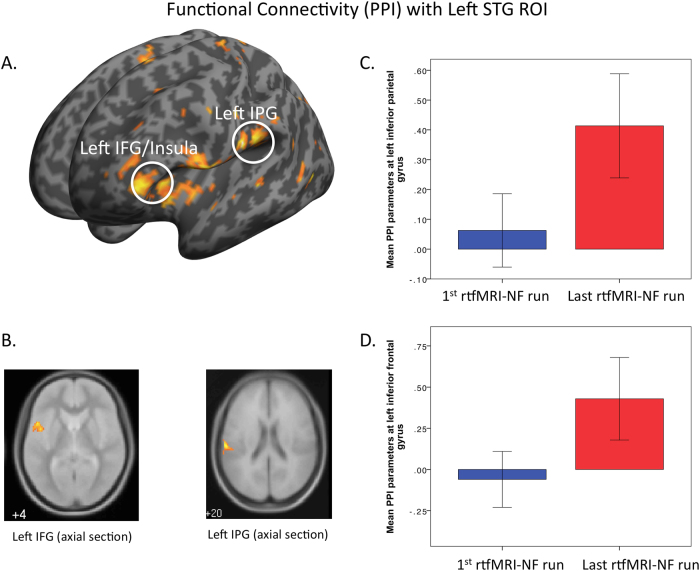
Fig. 3.
a SPM 3D render showing regions in left inferior frontal gyrus (IFG)/Insula and left inferior parietal gyrus (IPG)/supramarginal gyrus where functional connectivity was increased in the last rtfMRI-NF run compared to the first rtfMRI-NF (left hemisphere shown on left side of image) (p = 0.001 unc for purpose of figure). b Axial volumes showing left IFG and IPG regions. c Mean PPI parameter estimates in IPG/supramarginal gyrus for 1st vs. last rtfMRI-NF run and d mean PPI parameter estimates left insula/IFG for 1st vs. last rtfMRI-NF run

