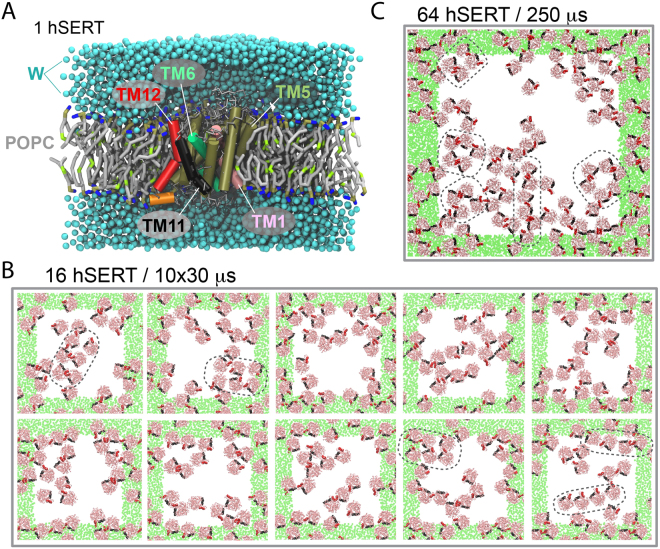
Figure 1.
Systems simulated. hSERT was embedded into a series of lipid bilayers (POPC, grey tails, and tan and blue headgroups) and solvated in water (W, blue). (A) One copy of hSERT embedded in 380 POPC molecules; some transmembrane (TM) helices are highlighted for convenience, and lipid and water molecules are not shown to feature the transporter. (B) 16 copies of hSERT inserted in a POPC lipid membrane. The final configuration of ten self-assembly simulations of 30 μs each are depicted. (C) Configuration of 64 copies of hSERT after a 250-μs self-assembly simulation. In (B and C), the systems are viewed from the top of the membrane, a 1:99 protein:lipid ratio was used, TM11 (black) and TM12 (red) are highlighted, the solvent and the lipid molecules are omitted for clarity, hSERT’s backbone trace is shown in pink, the green areas represent the periodic images of the central cell (white). In (B and C), a few illustrative aggregates are highlighted in black.

