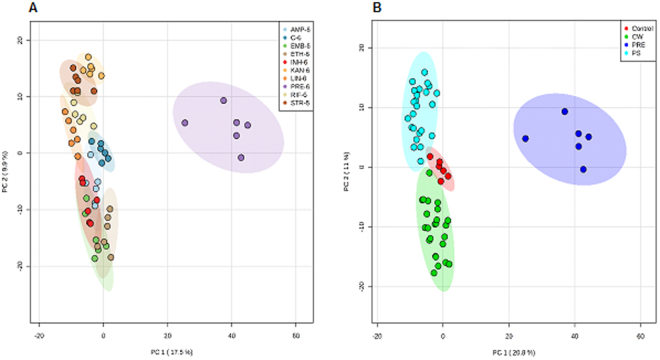
Figure 1.
Demonstrative principal component analysis (PCA) score plots of FIE-MS data of 2285 normalised m/z intensity values (P < 0.05) in both negative and positive ionisation mode, 6 h after antibiotic treatment: (A) AMP-ampicillin, C-control group, EMB-ethambutol, ETH-ethionamide, INH-isoniazid, KAN-kanamycin, LIN-linezolid, PRE-pretomanid, RIF-rifampicin, STR-streptomycin; (B) samples were clustered based on their mechanism of action, CW-cell wall synthesis, PS-protein synthesis, PRE-pretomanid treatment. Coloured regions display 95% confidence.

