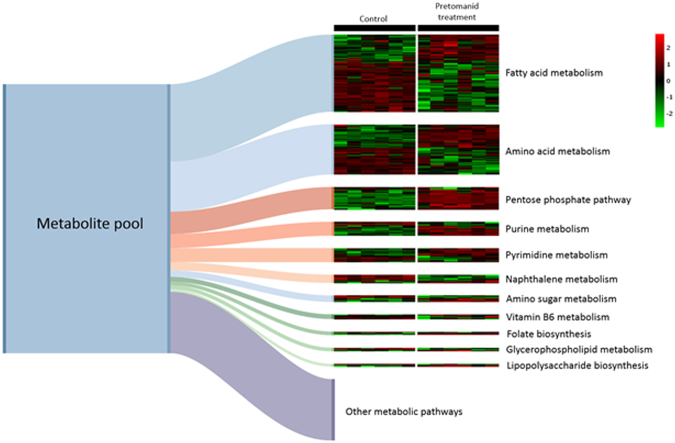
Figure 2.
A pool of 794 putative identified metabolites that were significantly differed (P < 0.05) between samples from control and treatment with pretomanid were mapped on to specific metabolic pathways as defined by KEGG (Kyoto Encyclopaedia of Genes and Genomes). The Sankey diagram shows the relative accumulation of metabolites per pathway. Only pathways where more than three constituent metabolites have been targeted are depicted as discrete pathways. The associated heatmap schematically represents the relative concentration of each metabolite in six replicates of untreated controls and pretomanid-treated (t = 6 h) Mycobacterium smegmatis cultures.

