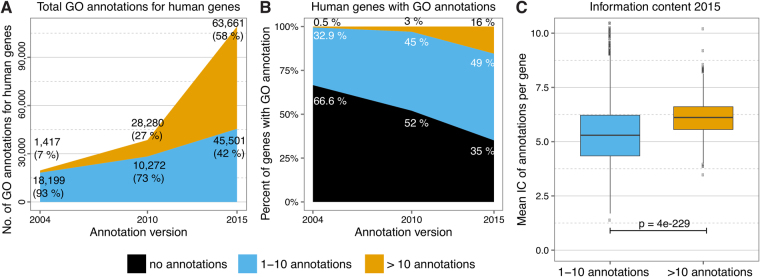
Figure 2.
Gene ontology annotation developments, human genome, 2004 to 2015. (A) Number of GO annotations and their distribution across poorly characterized (blue) and well-characterized (gold) human genes over time. (B) GO annotation status of the human genome (2004 vs. 2015). Genes are classified by annotation status in uncharacterized (black) vs. poorly characterized (blue) vs. well characterized (gold). Only terms relevant for enrichment analysis results were counted (excluding: IEA, ND and cellular component). C) Comparison of the average information content (IC) of poorly characterized vs. well-characterized human genes in 2015 shows that the mean IC for genes with more annotations was higher (p = 4e-229). The same difference was observed in 2004 (p = 2e-19, Supplementary Figure 4).

