Fig. 4.
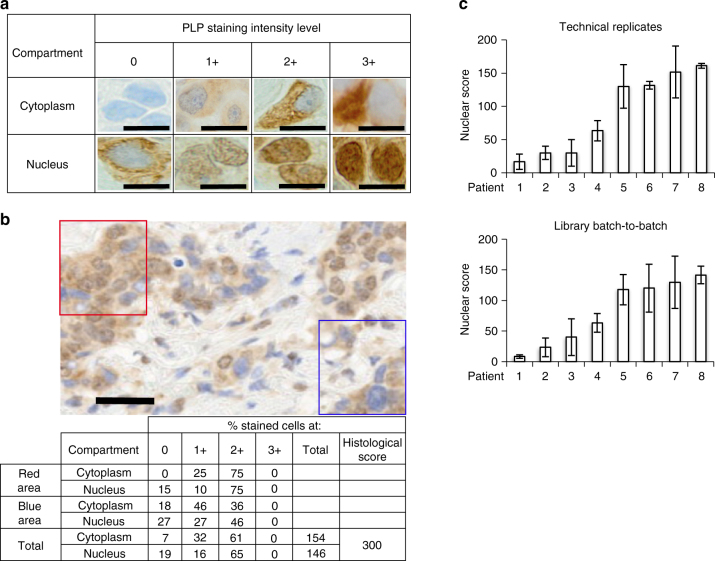
Histological score calculation based on the intensities of PLP staining and reproducibility of the staining. a Representative examples of the different PLP intensity levels in the cytoplasm and the nucleus of breast cancer FFPE tissue cells, compiled from different cases and different enriched libraries (×60, 10 µm scale bar). b Examples of the histological score calculations in two areas of the breast cancer tissue, stained with EL-NB. Note: assessment of the percentage of cancer cells with a particular staining intensity is usually performed on the entire tissue. Correspondingly, each stained case will have its unique cytoplasmic, nuclear and combined scores. Depending on the marker localization, nuclear, cytoplasmic or combined PLP scores can be informative for the differentiation of the benefiter from non-benefiter cases (×20, 20 µm scale bar). No adjustment was applied to images from microscopy. c Reproducibility of the PLP nuclear staining and scoring using EL-NB on eight different patients between technical replicates and different batches of the library preparation. TL-NB staining of the cytoplasm was not informative for the differentiation of B and NB cases. Patients 1–4 were selected as examples of relatively weak intensity staining, patients 5–8 are examples of relatively strong intensity staining (error bars are s.d. from three replicates)

