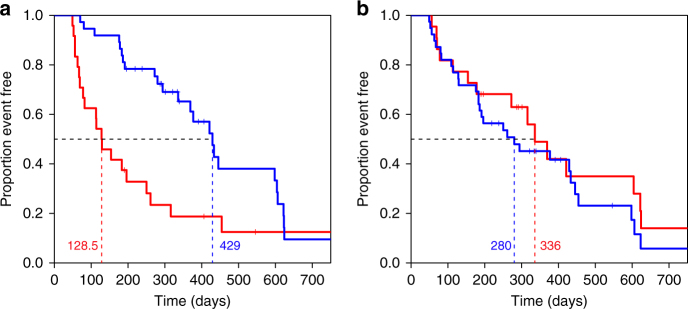
Fig. 6.
Kaplan–Meier curves of C+T- or T-treated breast cancer patients stratified by poly-ligand profiling or by tumour Her2 status. a Kaplan–Meier curve of C+T- or T-treated breast cancer patients stratified by poly-ligand profiling. The shortest distance between the ROC curves to point (specificity and sensitivity = 100%) determines the cutoff of test positive and negative and is represented as the blue point in Fig. 5c (Sensitivity: 78.6%; Specificity: 73.7%). “Event” is defined as the time point (days) at which a patient either deceased from cancer or at which trastuzumab-based treatment changed. Median time of benefit is 429 days for patients tested positive (blue, n = 37, event = 25) and 129 days for patients tested negative (red, n = 24, event = 20). HR = 0.384, 95% CI: 0.21–0.70; log-rank p = 0.001. The small vertical lines mark cases that were censored due to absence of treatment follow-up data (Supplementary Data 4). b Kaplan–Meier curve of C+T- or T-treated breast cancer patients stratified by tumours’ HER2 status. HER2 status of patients with both HER2 IHC and HER2 ISH test results was determined according to ASCO guidelines36. Median time of benefit is 280 days for HER2 positive cases (blue, n = 39, event = 29), and 336 days for HER2-negative/equivocal cases (red; n = 22, event = 16). HR = 1.27, 95% CI: 0.68–2.37; log-rank p = 0.448

