
Fig. 3.
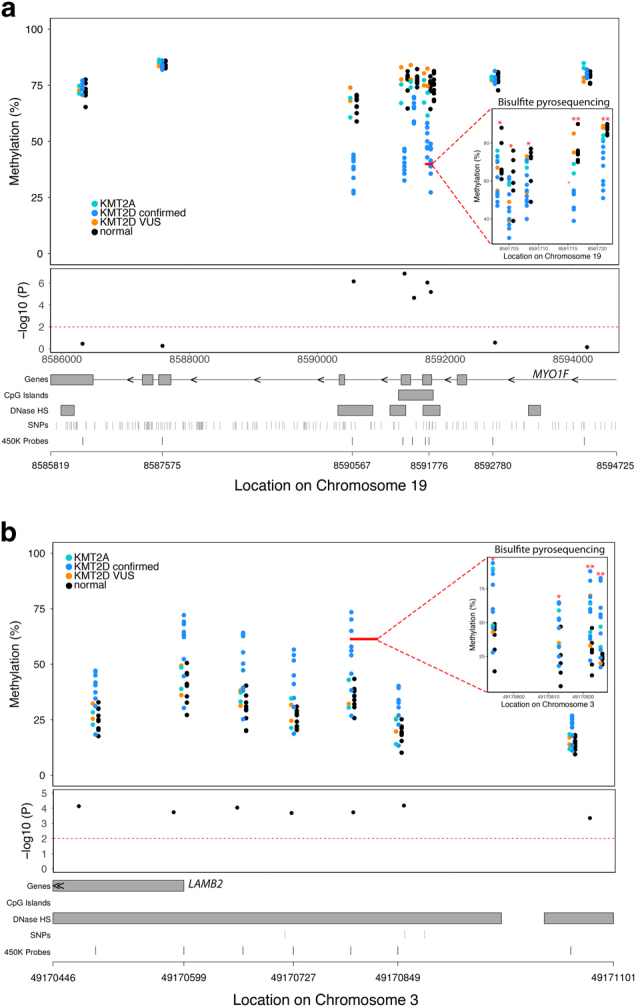
Examples of differentially methylated regions (DMRs) associated with Kabuki syndrome with KMT2D variants (KS-KMT2D) that alter function. (a) An example of a DMR within the MYO1F gene showing KS-KMT2D individuals have relative hypomethylation compared to non-Kabuki controls that we validated via bisulfite pyrosequencing. (b) Relative hypermethylation at the LAMB2 locus is associated with KMT2D variant that alters function that we validated with bisulfite pyrosequencing. Each of the upper panels displays genomic location on the x-axis and percent methylation on the y-axis. Inset top panel shows methylation values assessed using bisulfite pyrosequencing for the CpG sites in the region denoted by the solid red line. Black points denote non-KS controls. Blue points denote KS patients with KMT2D variants that alter function. Although not included in our main analysis, we also plot methylation values for individuals with Kabuki syndrome and variants of unknown significance (orange) and KMT2A variants (aqua) for comparison. Red asterisks denote significant differential methylation (*p < 0.05; **p < 0.01), via bisulfite pyrosequencing, between KS-KMT2D and control samples. The middle panel shows individual probe-based nominal p-values for differences in methylation between the two groups, with the dashed red line at a level of p = 0.01. The bottom panel provides gene annotation information for the differentially methylated region