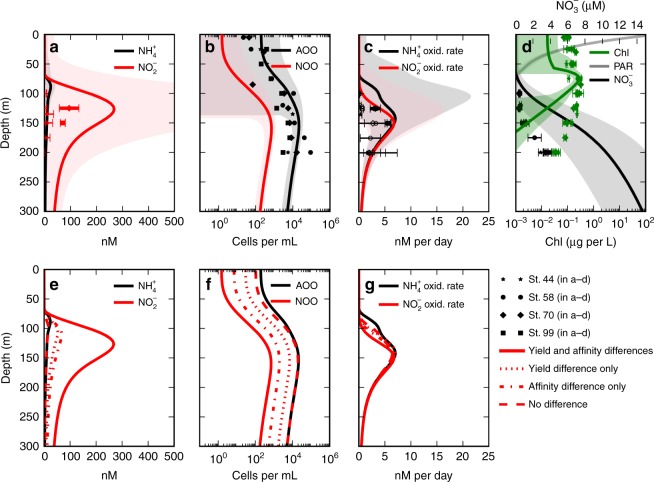
Fig. 3.
Stratified water column model solutions and observations from the subtropical North Pacific. Model solutions are indicated with lines, with shaded areas denoting 1 s.d. of the model ensemble. Observations from the four stations are indicated with marked points in a–d, with error bars denoting 1 s.d.: a [] and [] (the shaded region of [] reaches about 1000 nM), b ammonia-oxidizing and nitrite-oxidizing organism (AOO and NOO) abundances (observed amoA gene abundances), c nitrification rates, and d [Chl a], PAR (scaled to fit plot), and []. Observations below the detection limit are indicated with open (vs. filled) markers. Also shown are solutions to additional model experiments (e–g), with only the difference in yield (reflecting the threefold energetic difference), with only the difference in affinity (here, as the 4.6-fold decrease related to a 10-fold larger NOO cell volume), and with no quantitative difference in the parameters describing AOO and NOO metabolisms

